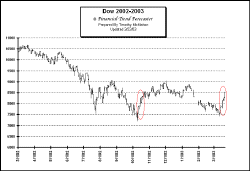
Last week I said, “On Wednesday March 12th the market neared its October lows but extremely significantly DID NOT break through to new LOWS! This is extremely Bullish! This is very significant. Even with all the negative news and fears about a WAR with Iraq… the market could not make a new low. This may very well be the bottom of the slide. The final confirmation necessary is another 2% up day on strong volume. This may come as early as Monday. A move below previous lows would of course negate the buy signal.” Then later on I said… Don’t miss the next few days in the market.
If you want to reread last weeks comments they are available here.
I could not have been more forceful, I did everything but jump up and down and beg you to get into the market! I said that we were entering a week very similar to the week last October where the market moved up dramatically.
Click on Chart to View Full Size

In the chart above you will note that the two weeks appeared almost identical except that this past week was even slightly better than last October! So now we have seen the Dow move up 1000 points in 8 days! We have seen the best week since 1982.
Did you take action or were you still paralyzed by fear? Did you follow my advice and order the Valueline information?
If you did you are on your way to positioning yourself for the bull market that will inevitably follow the bear market we have been in for the last several years. The worst thing about a Bear Market is that it paralyzes most people into inaction so they miss the best part of the next bull market. This Bull market although up 1000 points is still a calf! The time to act is before it becomes full grown.
What now?
Statistically we have a very good chance that this was the bottom but there are a few points of danger still ahead! Most of them are at the critical points I mentioned last week. I do not expect the market to continue up in a straight line. It never does. So we need to watch for signs of a retracement and a consolidation of these gains.
Last week I gave these key points (in Blue):
It is very possible that the indexes will go back and test their previous highs.
We can expect a rapid run up with the first resistance at the February plateau of 8000-8076 on the Dow.
We blasted right through this level of resistance as if it wasn’t there!
If it can break above 8076.02 it will probably rocket to test the January highs of 8869.29
We are currently at 8521.97 about midway between those two points and “rocket” was a good term for this week! So now we have about 300 points of headroom remaining. If we break above 8869.29 then it is on to the next resistance point!
But more likely we should expect the market to go up to test the 8869 level and then either move sideways a bit for a time of consolidation and base building or even more likely decline a bit and spend some time filling in the gap between 8318 and 8089.
After that in order to break out again the DOW will need to retest the level it reached and failed and then break above 8869.29 and the resistance points of 9043.37 and 9077.01
If it blasts through these points we are definitely in a new bull market.
If on the other hand it stumbles and falters and goes on to move below the low of last week, we can expect another down leg.
At this point I am betting on another couple of hundred points up, then a breather and retracement with an excellent buying opportunity as it declines and consolidates.
This breather could be brief if the pent up demand that I mentioned last week is more powerful than usual. But we have had a good run up with a lot of strength already.
Timing is everything. Last week was the perfect time to buy. If you are very long term oriented you can still begin averaging in now.
If you want to play the short term look for the run up and retracement (consolidation) and then the next big run up from there. Watch for a drop below 7779 as a caution signal and a drop below 7416 as a sell signal.
It is always darkest right before the dawn… but those who have the strength to act when all looks darkest are the ones who succeed in the market!
Timothy McMahon, Editor
Financial Trend Forecaster
The Web’s Premiere Inflation Website
www.Fintrend.com
www.InflationData.com
P.S.– Have you found these recent market commentaries helpful? If you would like to receive a weekly update on the market’s behavior similar to this one, let me know. If enough people are willing to pay for a year’s subscription I will consider creating a weekly update for those select few subscribers. This will not have any effect on the monthly inflation newsletter.
If you are interested in receiving a weekly update drop me a line at editor(at)fintrend.comif there is enough interest I will see about putting it together. At this point there is no obligation, just let me know if you are interested. Also let me know what you think it is worth… yes name your own price and if I think it would be worth the extra effort I will seriously consider it.
