A Multi-Year Technical Analysis Pattern “Bears” Watching
By Robert Jay
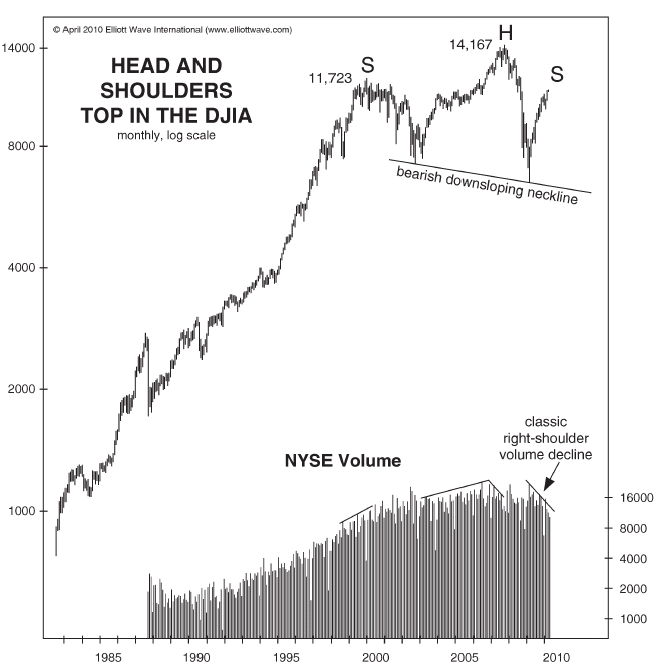
Earlier this year, EWI’s Robert Prechter described a “head and shoulders” pattern in the Dow Jones Industrials, saying it started in 1998 and is still unfolding.
Here’s an extended excerpt of Prechter’s commentary on this important pattern, from his April 2010 Elliott Wave Theorist (he acknowledged Edwards and Magee’s Technical Analysis of Stock Trends, 5th ed., pp. 50-57):
“Edwards and Magee define a head and shoulders pattern carefully. They say several pertinent things about it, beginning with a  description of its three main components:
 description of its three main components:
“[Left shoulder:] A strong rally, climaxing a more or less extensive advance, on which trading volume becomes very heavy, followed by a minor recession on which volume runs considerably less than it did during the days of rise and at the top.
“[Head:] Another high volume advance which reaches a higher level than the top of the left shoulder and then another reaction on … Read the rest of this post
