In today’s article Jared Dillian compares the 2/10 yield curve to a “Double Black Diamond” ski slope. In other words, it’s wickedly steep! The yield curve he is talking about here is the 10 year treasury yield minus the 2 year treasury yield. This spread measures the steepness of the yield curve. When it is high there is a big difference between the 10 year treasury yield and the 2 year. When it is small investors are not receiving much benefit for taking on longer term risk. Normally the yield curve is positive and longer-term rates are significantly higher than shorter-term rates. In abnormal cases the yield curve becomes “inverted” and short-term rates are actually higher than long-term rates. As Jared tells us, if even a small amount of inflation returns it will create havoc in the long term bond market. ~Tim McMahon, editor
Double Black Diamond
By Jared Dillian
 I was a halfway decent skier when I was a kid. Good enough that I could navigate every trail on the mountain except for one or two. Good enough that I could do the double black diamonds.My grandfather built a cabin on the access road to Sugarbush, Vermont, in the ‘80s and sold it in the ‘90s. Makes me weep when I think what that thing would be worth now. I wasn’t kidding when I said I come from a financially unsophisticated family.
I’m about to make a really corny analogy, but you know what’s as steep as a double black diamond ski trail?
The yield curve.
At least, it’s getting steeper at an alarming rate.
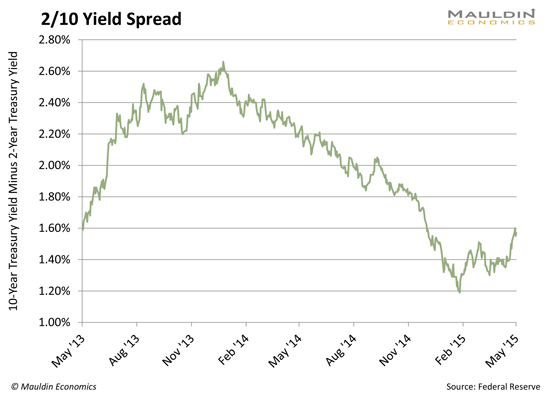 That’s not supposed to happen. Supposedly, the Fed is tightening monetary policy, or soon will. They are threatening to. And they have been threatening to for a while.
So if the Fed raises rates, short-term rates will go higher and long-term rates will go lower, or stay put. In the chart above, you see the spread between the yield on the 2-year note and the 10-year note.
The 2-year note yield is basically just a function of fed funds expectations, but the 10-year note yield is a function of many things—three things in particular I’d like to highlight:
- Inflation expectations
- Supply and demand for loanable funds
- Supply and demand for securities at that maturity
If you own a 10- or 30-year piece of paper, you really care about inflation. Even a small amount of inflation, over time, will erode the value of that security. Think about it. If you own a 30-year bond at a 2.5% yield, there isn’t a lot of margin for error. If inflation rises even a little, your real yield could be negative.
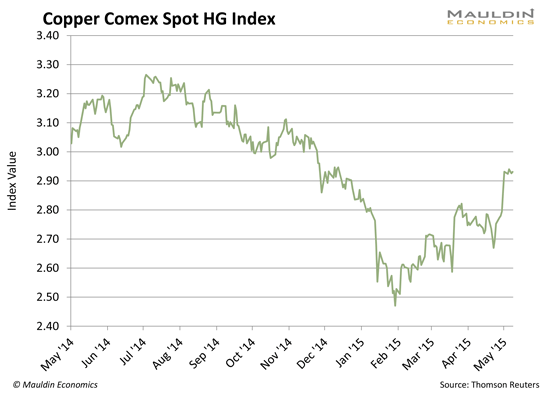
So when the back end sells off and the curve starts steepening, it’s usually because people start to worry about inflation. There is evidence for this. First of all, copper, steel, and iron ore are coming back—
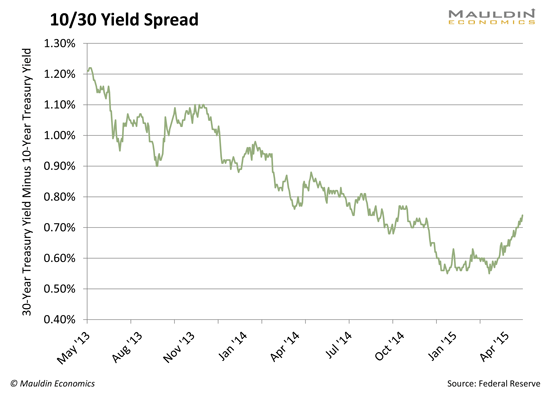
—and the yield spread most sensitive to inflation expectations, the spread between 10- and 30-year yields, is ripping higher.
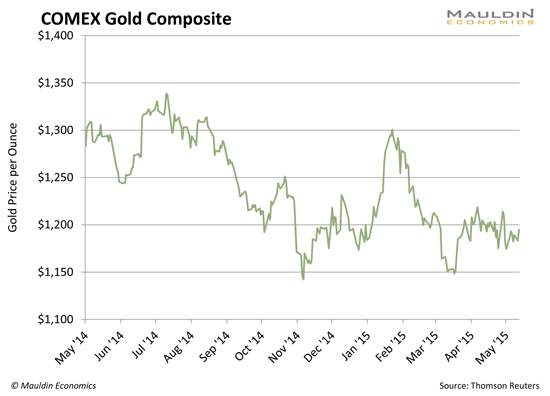
Gold isn’t doing anything yet, but hope springs eternal.
What the market is telling us is that the Fed waited too long to hike rates. Now inflation expectations are becoming unmoored. The consequences could be dire. If mortgage rates go up to 5%, people are going to notice. It would be bad for me because I’m trying to sell my old house (in an area where pretty much everyone depends on financing).
There is another way to look at this. I actually talk about the forces that determine interest rates in the class I teach. You can draw a supply/demand diagram for interest rates, just like anything else. Interest rates are a function of the supply and demand for loanable funds.
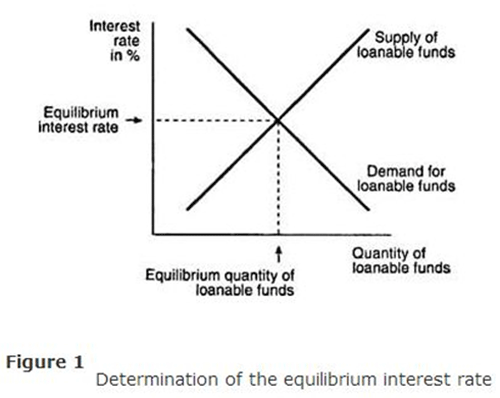
Source: cliffsnotes.com
If you think about it, we are literally choking on loanable funds. The banks are sitting on tons of cash and not lending it out, which you can see in this chart of excess reserves—
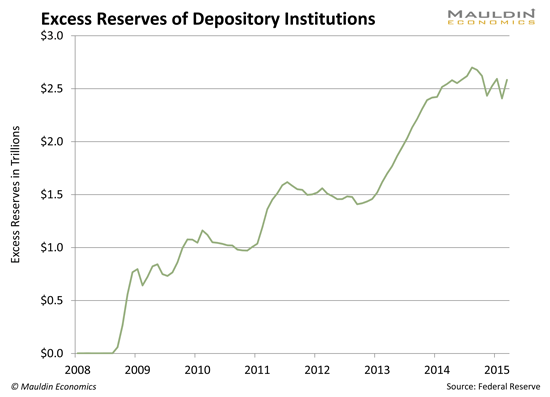
Little wonder that interest rates have been so low for so long! But now, perhaps, we’ll be seeing the first sign of demand for loanable funds. People borrow for 10 years or 30 years to fund long-term capital projects, like to build a house or maybe a factory. If after six years of what we’ve called a recovery, we are really having a recovery—maybe companies will rely a little less on buybacks and financial engineering and more on capital projects.
And finally, there has been near-limitless demand for 30-year paper from pension funds and insurance companies. Maybe something has changed?
What a Bond Bear Market Looks Like
Actually, we don’t really know what it looks like, because it’s been 30 years since we had one. A few things to think about—
Liquidity in treasury bonds is terrible. Which is amazing, right? Treasury bonds are supposed to be the most liquid instruments in the world. But Dodd-Frank came down hard on the credit default swap market, and that also had a huge effect on plain vanilla interest rate swaps, which have been around for ages and never posed a threat to anyone.
So people were driven out of the swaps market and into the futures market, which is imperfect, for technical reasons. Liquidity disappeared. It’s terrible. And in a post-Dodd-Frank world, you can’t go to a bank and ask for a bid on $100 million of bonds. Nobody will do it. Nobody will commit capital—too risky, too expensive.
So if we really are in a bond bear market, it’s going to be very disorderly. Remember the bond flash crash last October? That was just a taste. If there’s an asset on the board I would own, it would be interest rate volatility. Long gamma heaven!
The Risk Lives Somewhere
If the world’s biggest, most important asset class is going down for the dirtnap, who is going to get hurt? After all, the risk lives somewhere.
Answer: Baby Boomers.
They got wiped out in 2000-2002 and got killed again in 2008, at which point they said, “Screw it, stocks are impossible, we’re going all in on bonds.”
How do you think the PIMCO Total Return Fund (PTTRX) got so big? And more recently, the Vanguard Total Bond Market Index Fund (VBTLX)? I remember the days when the stock funds were the biggest!
One last thing to scare the pants off you, then I’m going to go. There is a concept known as duration that people use to measure interest rate sensitivity. The duration of the on-the-run 30-year bond is about 20 years.
So here’s the thumb rule: For every 1% change in interest rates, the price of the bond will decline by (approximately) its duration, in percent.
So if you own a mutual fund full of 30 year bonds, if interest rates go up one percent, your investment will lose 20% in value. If rates go up two percent, I mean…
I’d bet that two-thirds of bond mutual fund shareholders don’t even know the relationship between bond prices and interest rates.
Boy, this is going to be fun.
Jared Dillian
Very informative article, thank you. I’m a little confused,though, by this last paragraph:
So here’s the thumb rule: For every 1% change in interest rates, the price of the bond will decline by (approximately) its duration, in percent.
So if you own a mutual fund full of 30 year bonds, if interest rates go up one percent, your investment will lose 20% in value.
Shouldn’t it be 30%?
Good catch Jack it is a bit confusing. But I think he meant that because “The duration of the on-the-run 30-year bond is about 20 years”. So even though they are 30 year bonds they only have 20 years remaining so they only decline 20%. Make sense?