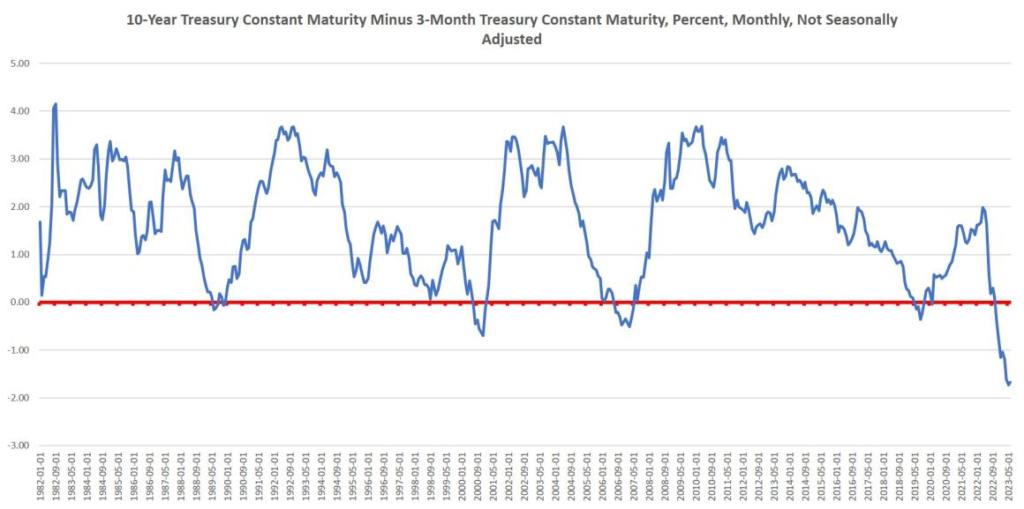
Deepest Yield Curve Inversion Since 1981
Mark Thornton and Ryan McMaken discuss the current yield curve inversion. The U.S. Treasury funds deficit spending by issuing debt instruments with a range of maturities. Treasury Bills have maturities from one month to one year. Treasury Notes have maturities from two to ten years. And long-term debt is issued as Treasury Bonds with 20- and 30-year maturities. The yield curve is created by comparing interest rates between ten-year debt to 3-month debt. Logically, long-term debt should require a higher interest rate than short-term debt simply because a lot can happen in ten years so there is more uncertainty, i.e., risk.
Deepest Yield Curve Inversion Since 1981 Read More »