What is the McClellan Index and why should you care? According to Investopedia, “The McClellan Summation Index is a long-term market breadth indicator based on stock advances and declines. The McClellan Summation Index is used in technical analysis and can be used to identify bullish or bearish bias, as well as the strength of the trend. It is a different way of quantifying the movements in the market other than looking at the price levels of the different indices.” And currently, the McClellan Summation Index is telling us that caution is warranted. ~Tim McMahon, editor.
The McClellan Summation Index has been “in a clearly defined downtrend since late December”
By Elliott Wave International
Many Main Street investors only pay attention to the daily trading closes of the main stock indexes. But those who fall in that camp are missing out on a lot of valuable insights regarding the strength or weakness of a trend. In other words, when it comes to the stock market, it pays to “look under the hood.”
For example, on Friday (March 26), all three major indexes rallied with the S&P 500 climbing 1.7% to hit a record closing high. Those who glance at the stock market headlines may have concluded, “all systems go.” Yet, on Monday (March 29), our U.S. Short Term Update took a look “under the hood” and saw a rally that was showing signs of fatigue. Here’s a chart and commentary:
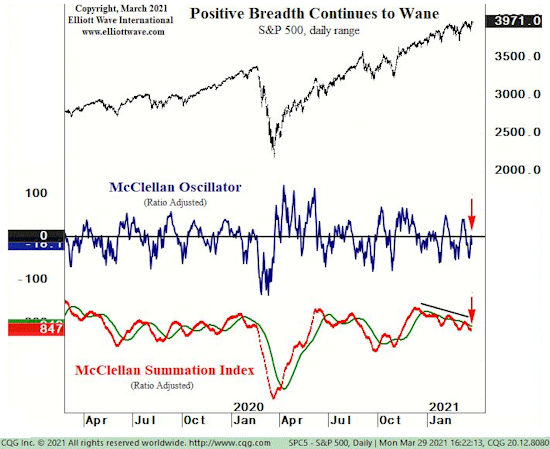
Today’s Dow rally to a new high was attended by a negative NYSE advance/decline ratio of 0.48:1 and more down volume than up volume. … The weak breadth measures are seen on the chart of the McClellan Oscillator in the middle graph and the McClellan Summation Index in the lower graph. The McClellan Oscillator is an indicator based on the exponential moving averages of the daily advance/decline data and the Summation Index is in essence a running sum of the daily values of the Oscillator. The Oscillator has been traversing the zero line, while the Summation index is in a clearly defined downtrend since late December.
Interestingly, the very next trading day, all three indexes closed lower.
The message of the McClellan Oscillator and Summation Index align with the message of the Elliott wave model.
If you’re unfamiliar with the Wave Principle, or need to brush up, here’s a quote from the Wall Street classic, Elliott Wave Principle: Key to Market Behavior, by Frost & Prechter:
In the 1930s, Ralph Nelson Elliott discovered that stock market prices trend and reverse in recognizable patterns. The patterns he discerned are repetitive in form but not necessarily in time or amplitude. Elliott isolated five such patterns, or “waves,” that recur in market price data. He named, defined and illustrated these patterns and their variations. He then described how they link together to form larger versions of themselves, how they in turn link to form the same patterns of the next larger size, and so on, producing a structured progression. He called this phenomenon The Wave Principle.
Although it is the best forecasting tool in existence, the Wave Principle is not primarily a forecasting tool; it is a detailed description of how markets behave. Nevertheless, that description does impart an immense amount of knowledge about the market’s position within the behavioral continuum and therefore about its probable ensuing path. The primary value of the Wave Principle is that it provides a context for market analysis. This context provides both a basis for disciplined thinking and a perspective on the market’s general position and outlook. At times, its accuracy in identifying, and even anticipating, changes in direction is almost unbelievable.
You can read the entire online version of the book for free.
That’s right — all that’s required is a Club EWI membership. Club EWI is free to join and allows you access to a wealth of Elliott wave educational resources.
Get started by following this link: Elliott Wave Principle: Key to Market Behavior — free and unlimited access.
This article was syndicated by Elliott Wave International and was originally published under the headline Why These Stock Market Indicators Should Grab Your Full Attention. EWI is the world’s largest market forecasting firm. Its staff of full-time analysts led by Chartered Market Technician Robert Prechter provides 24-hour-a-day market analysis to institutional and private investors around the world.