Featured Charts
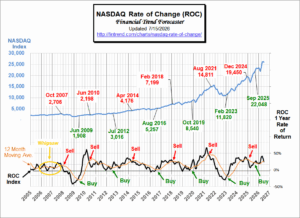
NASDAQ Rate of Change (ROC)®
By Tim McMahon Updated July 15, 2026 Current Analysis: NASDAQ ROC has a hold signal. Commentary: In September 2025, the NASDAQ moved back above previous highs, and our ROC generated a Buy signal. The NASDAQ had been rocketing upward since, but seems to be taking its typical Summer break now. The ROC is flirting with […]
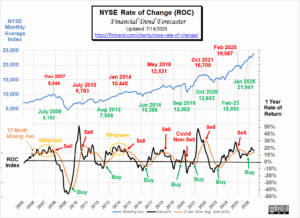
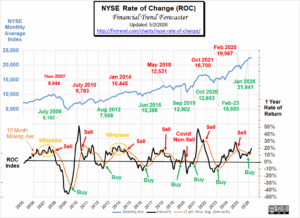
NYSE Rate of Change (ROC)®
What is the NYSE Rate of Change (ROC)®? The NYSE Rate of Change (ROC) chart helps quickly get the “big picture” of the stock market. The old saying “a picture is worth a thousand words” is very applicable to this chart. Once you understand how to read the ROC chart, you can easily spot the […]
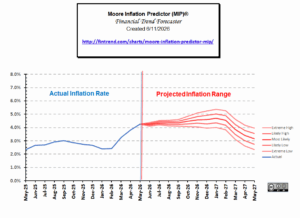
Inflation Forecast: Moore Inflation Predictor (MIP) ©
Forecasting Inflation: Using the Moore Inflation Predictor© By Tim McMahon, editor The Moore Inflation Predictor© (MIP) is a highly accurate graphical representation designed to forecast the inflation rate. By watching the turning points, we can profit from inflation hedges (like Gold, Real Estate, and Energy Producers) when inflation is trending up. And from Bonds when […]
Articles

Will New FED Chair Warsh be Hawkish or Dovish?
By Tim McMahon |

Changes at the Federal Reserve: New Leadership, New Direction
By Tim McMahon |
Where the Markets Stand Based on ROC Analysis
By Tim McMahon |

Will the Collapse of OPEC Result in Lower Oil Prices?

The California Energy Crisis

Energy Is Non-Fungible: Costing the World Billions

Aluminum The Battery That Could Render Lithium Obsolete

The Pipes of Global Finance Are Getting an Upgrade

What Caused Bitcoin to Crash 14% in a Single Day?

Did the Crypto Bear Market Begin in October 2025? Or Earlier?
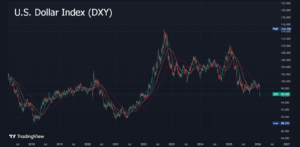
FED Holds Steady- Dollar Declines
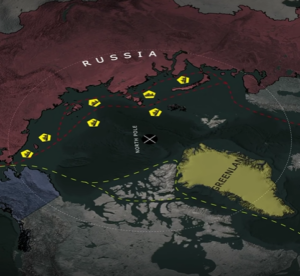
Why Greenland Matters: U.S. Strategy and Influence in the Arctic

January 2026 ROC Charts Update

Tether and Gold Holdings by Country