Why the Deviation?
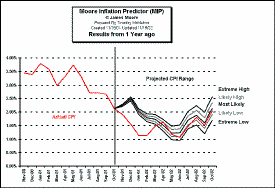
This historical chart has been posted in response to a question posed by a regular viewer. He asked why our projection deviated so drastically from from the actual CPI as shown by the red line on this chart. As you can see the deviation occurred for several months but during the most recent months our projection from last November has been amazingly accurate. As you can see the red line has tracked the “most likely” line very closely.
So the question remains why was our projection so far off during the period from October through April? We must remember that the MIP is a mathematical projection and there are a few thing beyond its scope. Those things are large random political forces.
Some examples of these type of forces are:
- The FED changing interest rates
- A sudden Stock Market Crash
- A breakout of War
- A large terrorist attack

Did any of these items happen just prior to the deviant period? The answer is obviously yes the 9/11 attack is probably responsible for the deviation. If we think about it logically, would that attack be inflationary or deflationary? It would probably be a massive deflationary force, since Billions of Dollars in real estate, jobs, travel, tourism, etc were destroyed. And that is exactly what we see in our chart. The FED was trying to increase money supply during that time period but instead Billions of Dollars was removed from the money supply. This counteracted the slight upward force that was in the works for that time period and instead created a drastic downward move. The overall direction was downward anyway, so the major portion was simply accelerated and happened a few months early.
What does this teach us for future projections? Simply that large random events, (the type that make it to the newspaper headlines) can affect the results and skew the results away from our mathematical projections. So you need to factor any of these type of events into your own projections.

