The long-term direction of the Fed is not in doubt: they are debasing the dollar.
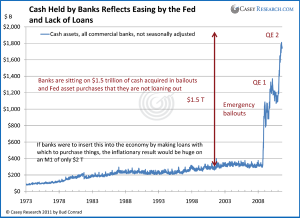
In the next chart, we look at the mirror image of the commercial bank deposits at the Fed – the cash being held on the balance sheet of the banks. As you can see, this confirms that instead of making loans, they are holding cash, mostly in the form of these Fed deposits. The effect is that the Fed policies have had much less effect on the economy outside of the banking system than would usually be the case, given their extreme bailouts and money “printing.” Inflation has been contained to commodities, and interest rates have remained at record lows.
The fact that this money sits mostly as cash deposits at the Fed is why the QE programs have had little effect on the economy. Rather, it is clear that the Fed’s priority has mostly been to provide support for the banking system. Though going forward, these deposits – almost $2 trillion – could be easily loaned into the system, and the result could be very inflationary.
Europe Is Turning to the US Dollar and to Gold for Safety
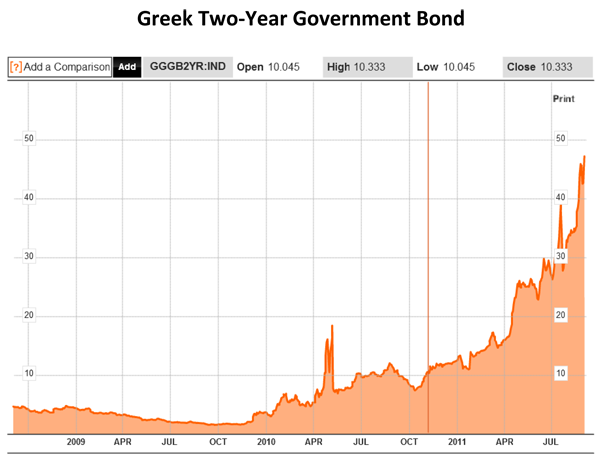
The loss of confidence in a country is most obvious when lenders demand high interest rates to loan money to a government by buying their bonds. With the yield on two-year Greek government-issued notes now at 45% and one year being quoted at 70%, the situation in Greece has gone beyond the level where the government can operate.
The risk in Europe is rapidly becoming more acute as the promised bailouts aren’t happening and the population of Germany is turning against a further expansion of the European Financial Stability Facility (EFSF) that was set up in an attempt to calm the situation. A series of routs for German Chancellor Angela Merkel’s political party in recent local elections reflects the public discontent with further bailouts at the German taxpayer’s expense.
The Wall Street Journal reported on September 5: “The suspension of the talks in Athens between the government and a group of officials representing the providers of Greece’s bailout cash came, officials said, amid a dispute about how to address new gaps opening up in the government budget deficit.”
In September, the Bundestag (the German parliament) is expected to decide on a package that empowers the EFSF to buy bonds preemptively and recapitalize banks. While the bill is likely to pass, the furious debate leaves no doubt that Germany will resist moves to boost the EFSF’s firepower yet further. Some say the fund needs €2 trillion to stop the crisis from engulfing Spain and Italy.
In short, the very fate of the European monetary union is hanging by a thread. And, as noted earlier, the banking crisis will be more difficult to handle this time – the governments are in much worse shape because they took on so much additional debt in bailing out the banks to this point. So this time a private banking crisis could become much worse, leaving the central banks as the buyers of only resort for government debt. Should that occur – though we at Casey Research believe it’s a matter of when, not if – it will be the starting gun for the end of the fiat currency systems.
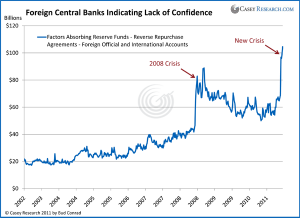
In the meantime, the next chart shows clear signs that foreign central banks are beginning to run scared – indicated by a soaring willingness to park money with the Fed. They were big users of reverse repos when the Lehman collapse signaled the onslaught of the credit crisis, and their holdings just spiked again in the face of European weakness.
The interpretation is that foreign central banks are finding the safety and returns in the US more attractive than their own banks. Regardless of the causes, this measure reflects banking system fear and is indicating more trouble ahead.
The result of a loss of confidence in Europe is a flight to safety, i.e., to the Swiss franc, the dollar, and to gold. The dollar has been less coveted because of its own flaws.
US Money Growth Is Picking Up
Recently, the money supply has taken a jump with Fed liquidity, and commodity prices have risen.
We need to consider that international forces may be a factor in driving US money growth. A European loss of confidence is decreasing the attractiveness of keeping deposits in European banks and may be behind the increase in deposits at US banks. Cash assets at foreign institutions in the US have jumped from $400 billion to $800 billion since the beginning of 2011. It is certainly not a booming US economy driving the US money supply; this increase in foreign deposits is suggesting the money supply increase is due in some part to a flight to safety from worried Europeans.
Back to Gold
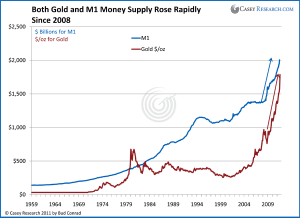
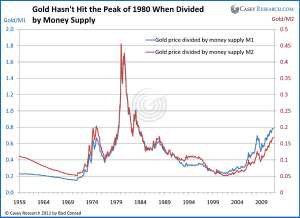
As we are trying to revisit our base case for gold going forward, let’s return to the ultimate safe harbor. The next chart illustrates, through the ratio of gold to the increase in M1 and M2, that gold is still well below its peak of 1980.
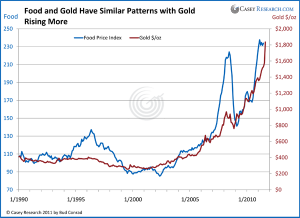
In the chart below, I look at one slice of the analysis that shows that money printing and fiscal deficits have driven commodity prices higher. As you can see, the index of world food prices has risen 40% over the last year. It was rising fast before the credit crisis, dropped during the worst of the crisis and is rising again, along with gold.
As should be clear, deflation is not part of the story for food or gold. The path forward points to higher prices, especially if the banks return to their core business of lending. The right way to look at the speculative fever is not to look at the gold market but to what the government is doing to the currency. There is a lot more debasement to come – which means a lot more price rise ahead.
Gold Is Not Record High in Inflation-Adjusted Terms
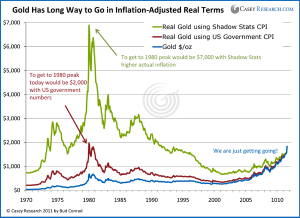
Gold is just bouncing off $1,900/oz highs, a record in nominal terms. The blue line shows the average monthly price of gold. As you can see, the previous peak was in 1980 at $675 per ounce monthly average, which included an intraday high of $850. But the dollars of 1980 would purchase more than the dollars of today. To estimate the number of today’s dollars that would be required in 1980, we can use the inflation index of the Consumer Price Index (CPI). The red line indicates that even by this manipulated government measure, the 1980 price of gold in today’s dollars would be $2,000. We are getting close but have not yet reached the old peak.
However, as you are probably aware, the government’s CPI numbers seriously underreport the amount of inflation. The government has made a number of significant adjustments to its CPI calculations, all of which cause it to be understated compared to the CPI as constituted in 1980. Thus, for example, today’s CPI uses rental equivalent for housing costs; inflation is revised downward based on new improvements in products; and even the basket of commodities used in the calculation is changed when an item becomes expensive.
Another view of inflation comes from John Williams of Shadow Stats, who removes the adjustments and concludes that inflation is much higher than the CPI admits to. Applying his inflation numbers suggests that the 1980 gold price peak would have been $7,000 in today’s dollars, as indicated in the green line. The visual conclusion is that in inflation-adjusted terms, gold still has a ways to run.
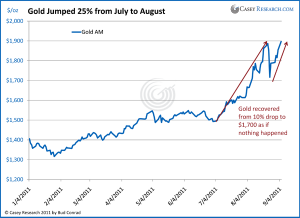
A one-year chart of gold shows it already exceeding my prediction of rising to $1,800 by the end of the year. The subsequent drop of 10% from $1,900 to $1700 was surprising, but not enough to indicate a change in direction because gold had risen so much just since July. The drop may have been inspired by exchange margin hikes, which hurt momentum and highly leveraged traders, but margins do not change fundamentals. The margin hike of 27 % in August was in line with the preceding price rise, and the subsequent price recovery confirms that the effect was short lived.

