It has been a long time since there has been any positive news for the stock market. In our January 12th, 2023, NYSE ROC report, we changed from a “Sell Signal” to a “Hold Signal” because of some positive indications in the market. Although the ROC has not yet switched to a “Buy”, we noticed a few positive indicators that could indicate either a bottom has been set or that we are in for a short-term rally. Some may call this “green shoots” in the market.
Here are both the positive and the negative indicators as we see them.
Positive:
- Typical corrections lose between 20-30% from the peak, and we are currently within the “normal” correction range.
- The broad-based NYSE index is above its 50, 100, and 200-day moving averages.
- The 50-day average has crossed above the 100-day and 200-day average.
- The market has registered a “higher high”.
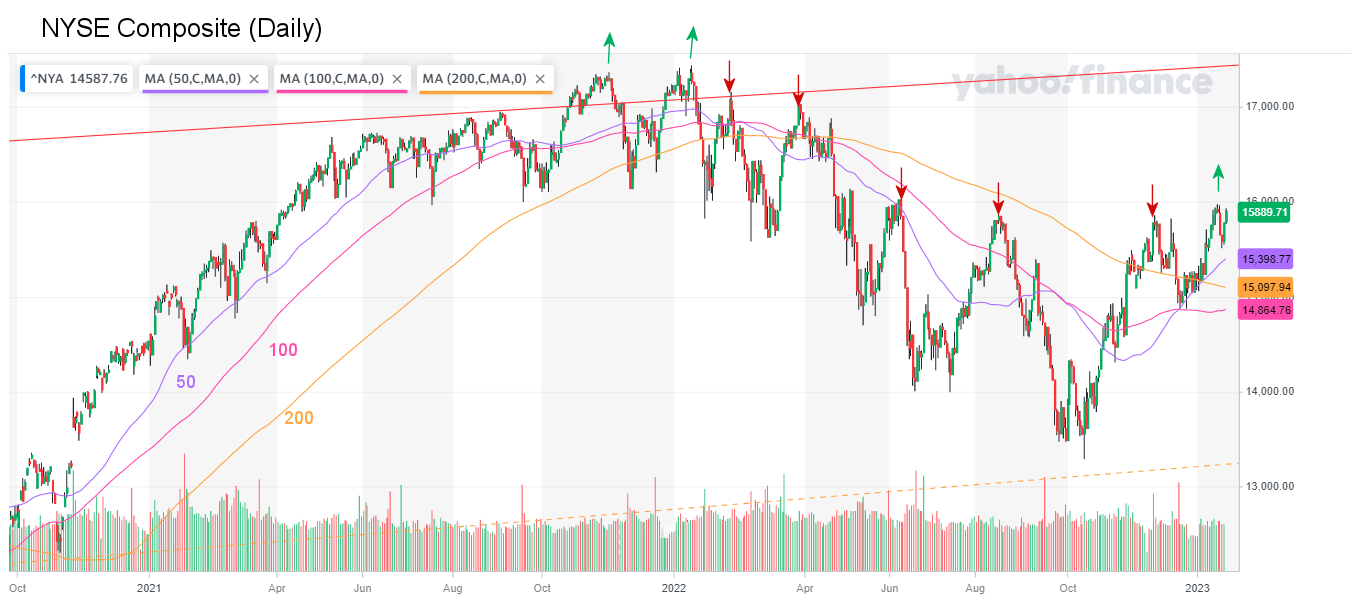 Looking at the above chart, the green (upward) arrows indicate higher highs, while the red (downward) arrows indicate lower highs. Obviously, as long as the market continues to make lower highs, it is in a downtrend. On January 17th, 2023, almost a year to the day from its all-time high, the NYSE made a high that exceeded the previous high. This could possibly be the beginning of a new trend.
The fact that the shorter-term moving average is above the longer-term averages also indicates that we are in an uptrend (at least for the short term).
There are still a few negative indicators, so we still must be cautious.
Negative:
- The ROC hasn’t issued a “Buy Signal”.
- Typically bear markets don’t end until the FED begins easing.
- Some market crashes are much larger than normal (i.e. over 50% loss from the peak).
Typically, the ROC is very cautious about issuing a buy signal, so the fact that it hasn’t yet doesn’t mean that it won’t in the next few months. At the moment, things are looking positive and aggressive traders could start phasing back into the market, but only with a small portion of their assets. This could be a “head-fake” or “whipsaw” in the making with the slightest bit of bad news, but at the moment, it is looking good for a change.
The Weekly NYSE
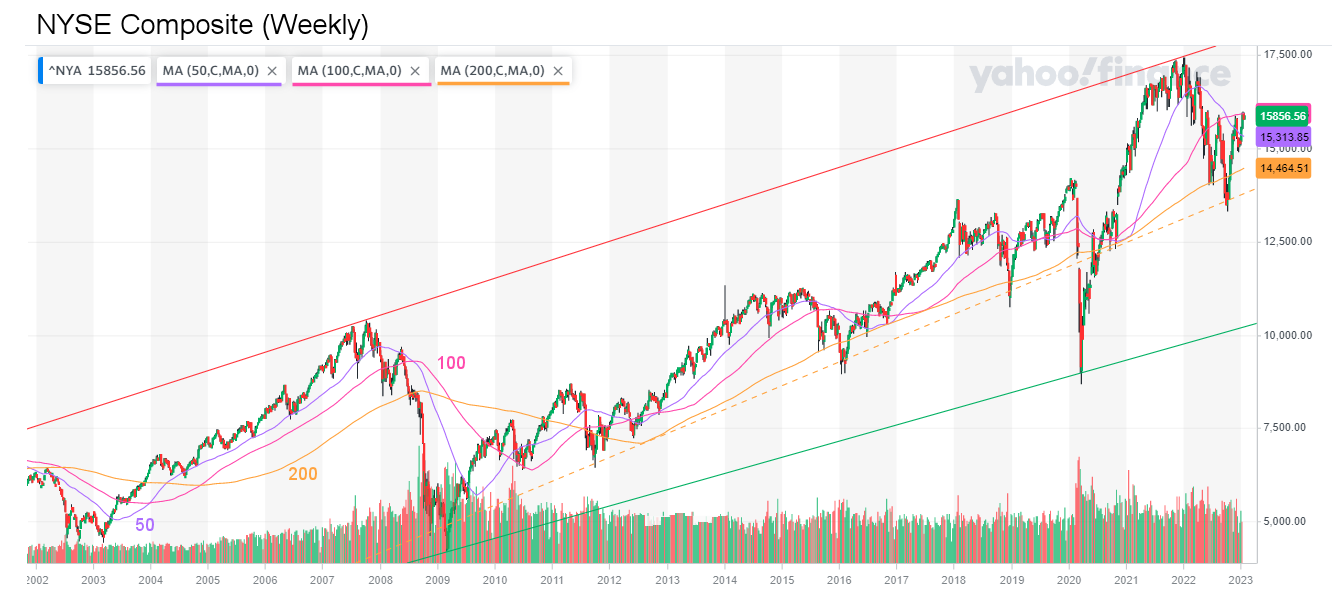 Looking at the weekly NYSE chart, we see:
The recent “correction bottomed at the yellow dotted line where most corrections finish. Only very severe crashes like 2008-9 and 2020 went to the green long-term support line. So, we could easily have seen the bottom.
The market has regained roughly half of its losses.
The one negative is that the 50 WEEK moving average is still below the 100-week average but that would be true during the early phase of a new bull market. We should not expect a move straight up from here. Stocks Don’t Go Straight Up (or Straight Down). But following a Dollar Cost Averaging plan at this point would probably be beneficial. If you moved funds out of the market you could schedule a portion to be moved back every month or new funds could be moved into the market at regular intervals. The market is certainly less risky than it was a year ago, but the one remaining wrench in the works is the FED. Just as they waited too long to admit that inflation was a problem, they could continue to tighten too long and kill these green shoots we are currently seeing. Looking at the current inflation rate, we can see that the trend is down and our Moore Inflation Predictor is forecasting lower inflation for the next six months at least. So, the FED should at least slow their tightening.
For more information see:
NYSE Rate of Change (ROC) and NASDAQ Rate of Change