Stocks: Inflection Point Says Big Move May Be Coming
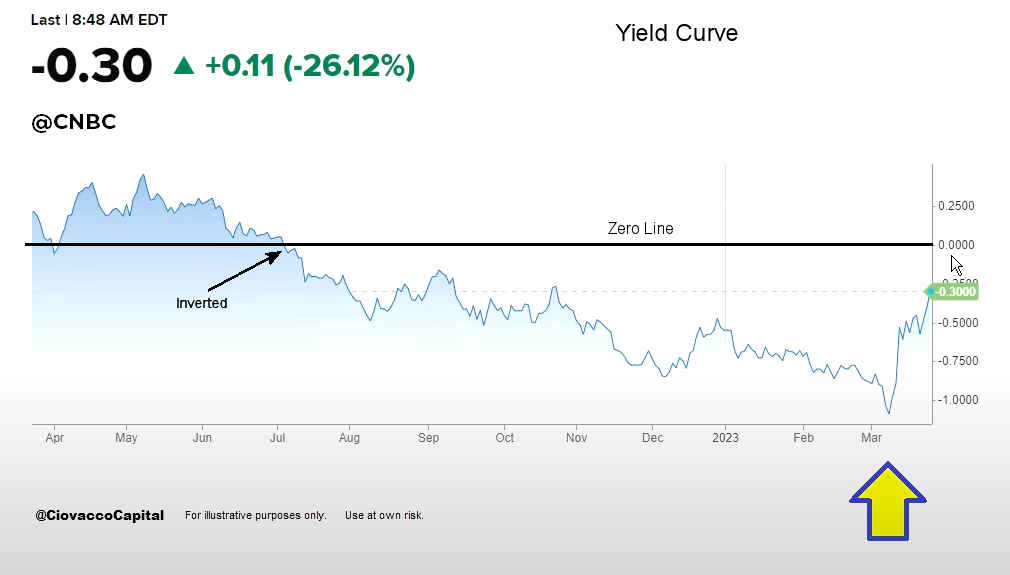
Today Chris Ciovacco of Ciovacco Capital Management looks at the market situation in light of the bank failures. First up is the Inverted Yield Curve. We can see that it originally inverted in July of last year, when short-term interest rates moved higher than long-term rates. From there it moved steadily lower before rebounding earlier this month. So although it is still inverted it is not anywhere near as bad as it was just a few weeks ago.
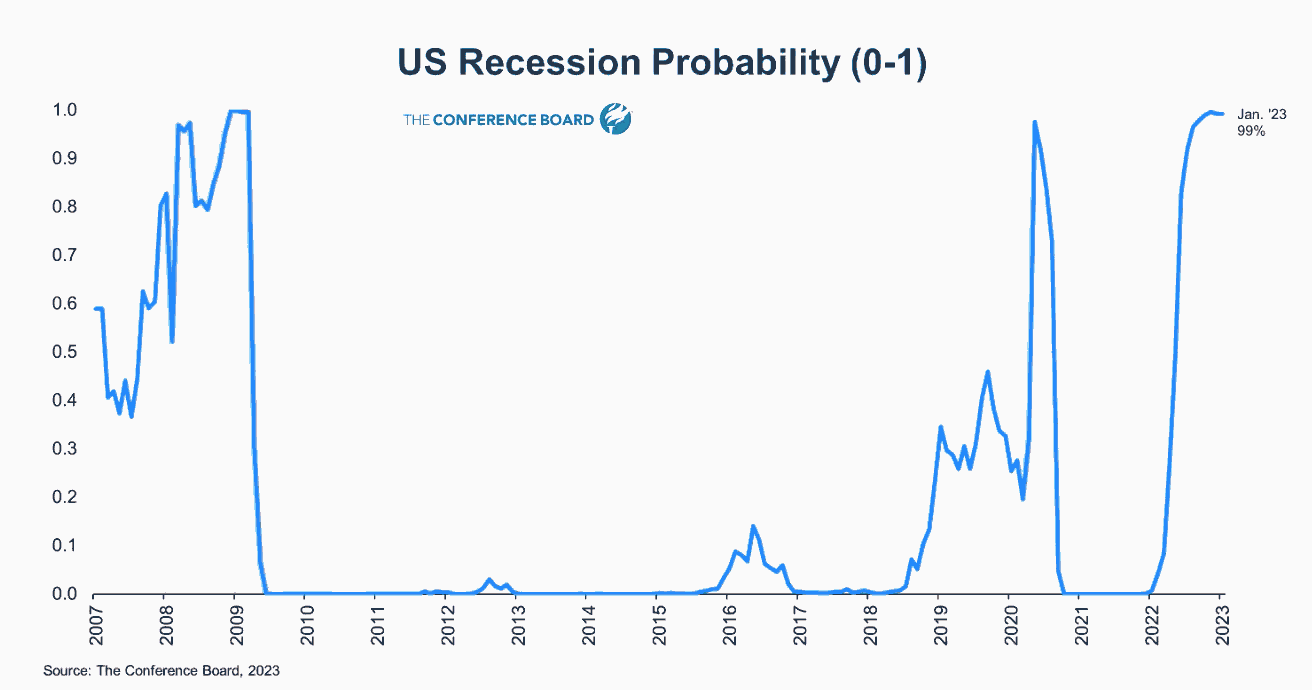
The conference board is projecting a 99% probability that we will enter a recession in the next 12 months, which perversely is exactly what the FED is hoping for in its effort to curb inflation. The unemployment rate hasn’t cooperated yet as employment has been unusually strong despite the FED’s efforts to cool the economy. Typically, the stock market doesn’t bottom until a recession starts, so although this time may be different, we can’t count on it.
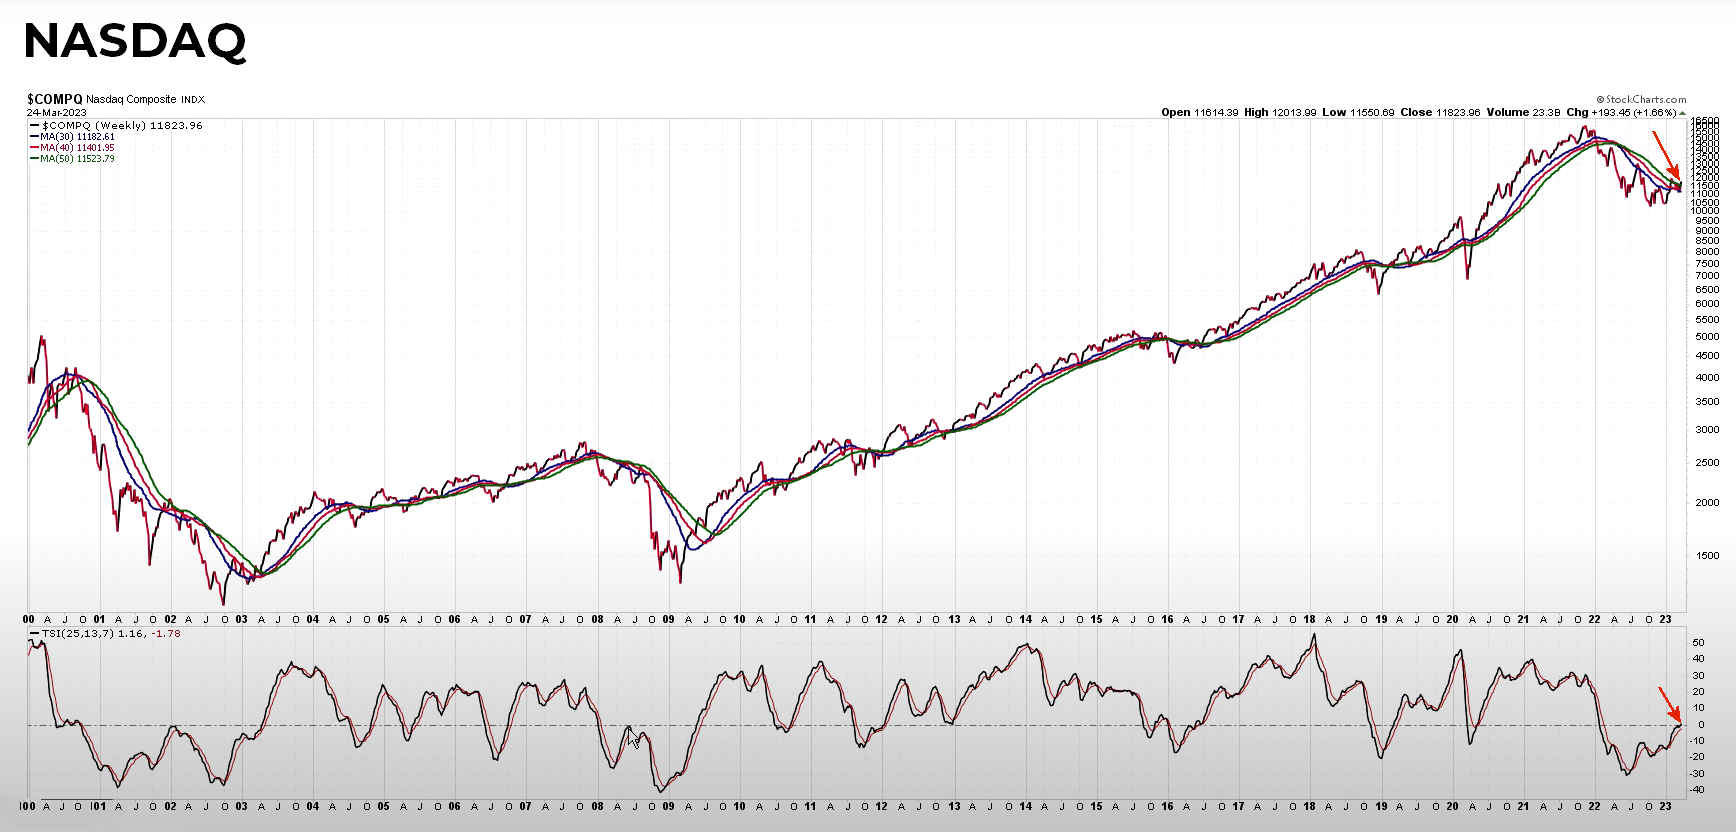
At the close on Friday, March 24, the NASDAQ showed slight signs that open the possibility of a rebound (red arrows).
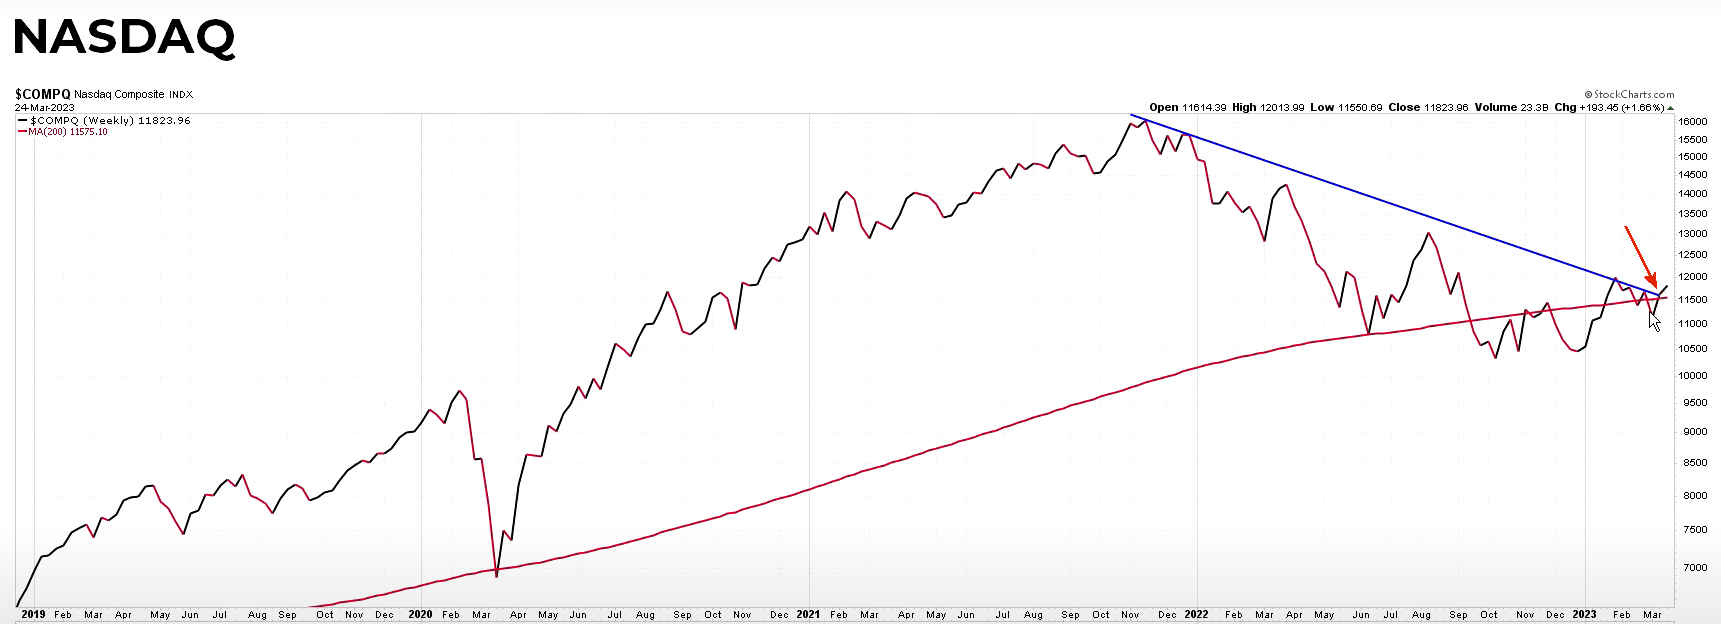
In the following chart, once again not earth-shattering but NASDAQ crossed above the trendline.
Based on Bollinger bands and other charts, at this point, NASDAQ remains in “No man’s Land” not really bad but not great either. Ciovacco’s model says there has been a lot of improvement in recent months so we need to keep an open mind toward the possibility that the market will pull out of its funk and improve but there are no guarantees.
How is it possible for Stocks to Rally?
- Setups are better than most would believe
- Liquidity injections
- Rates may slow inflation/economy
- FED may be able to back off
- Sentiment slanted for an extended period
- The economy has been resilient (demographics)
- Credit has not dried up (to date)
- Markets have been basing/coiling (credit)
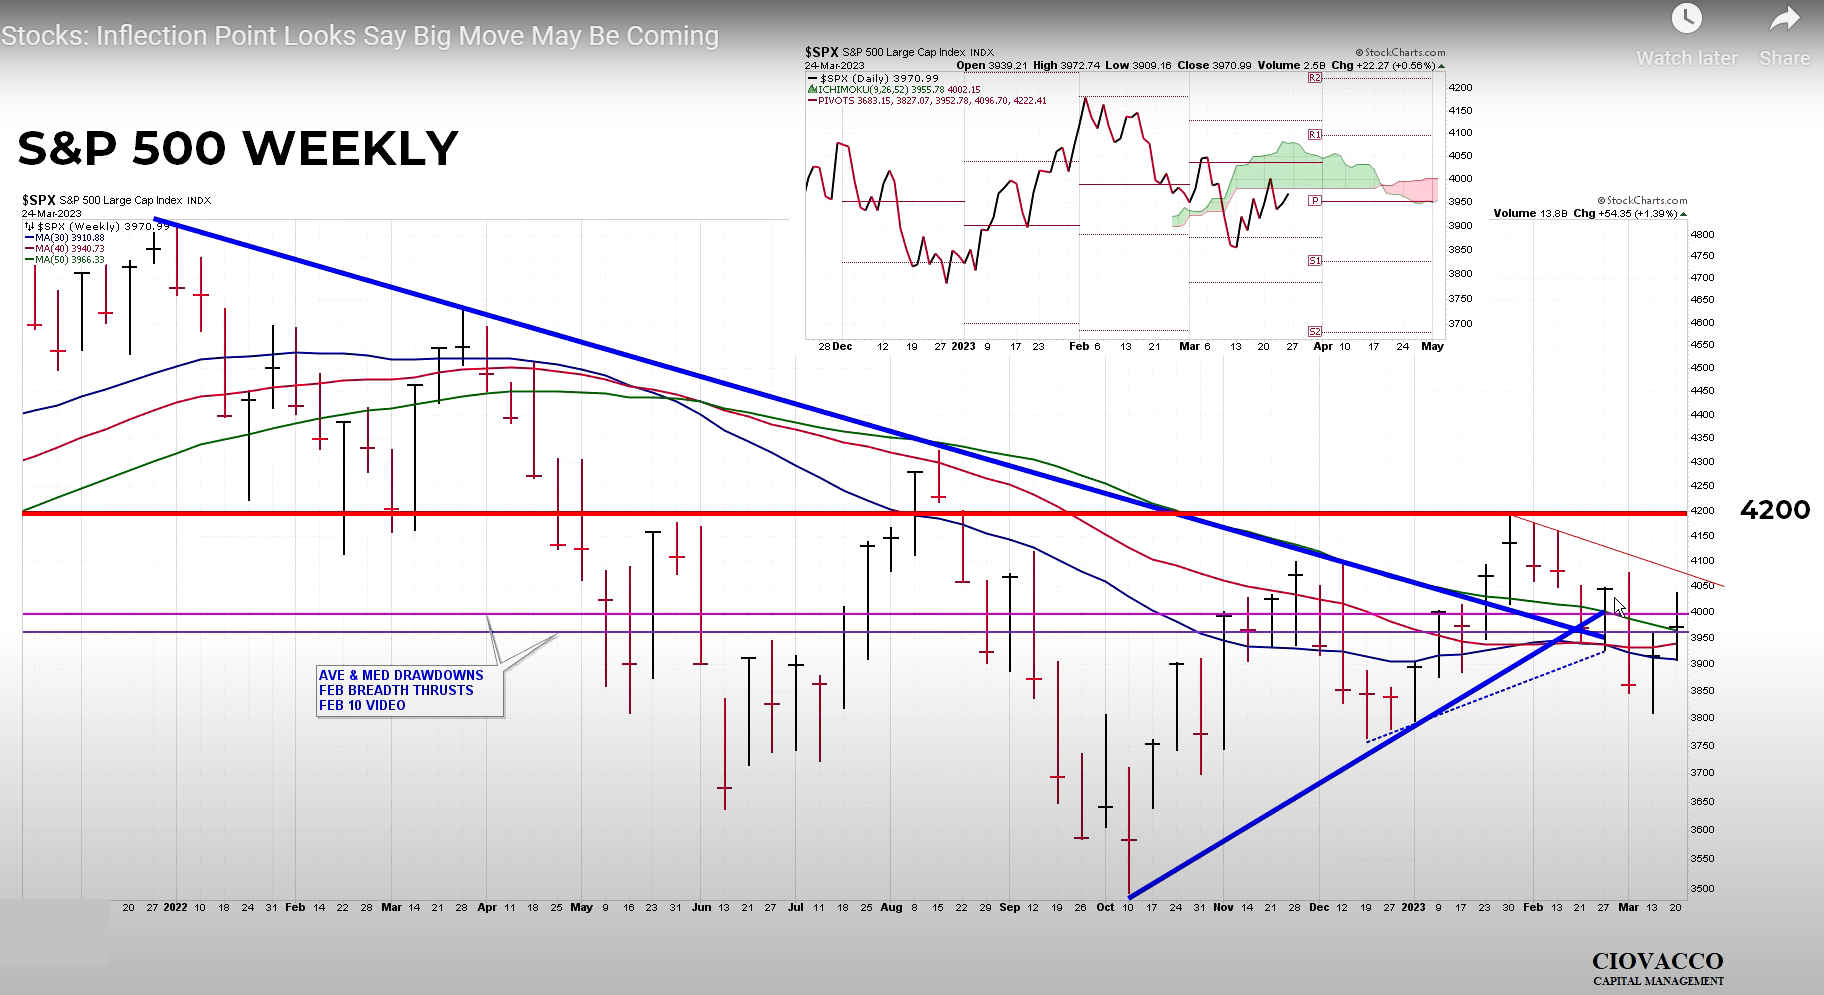
S&P 500
We are approaching a “Stock Inflection Point i.e., a big move is in the making. Unfortunately, the move could be in either direction. For really good things to happen the S&P 500 has to break (and stay) above 4200.
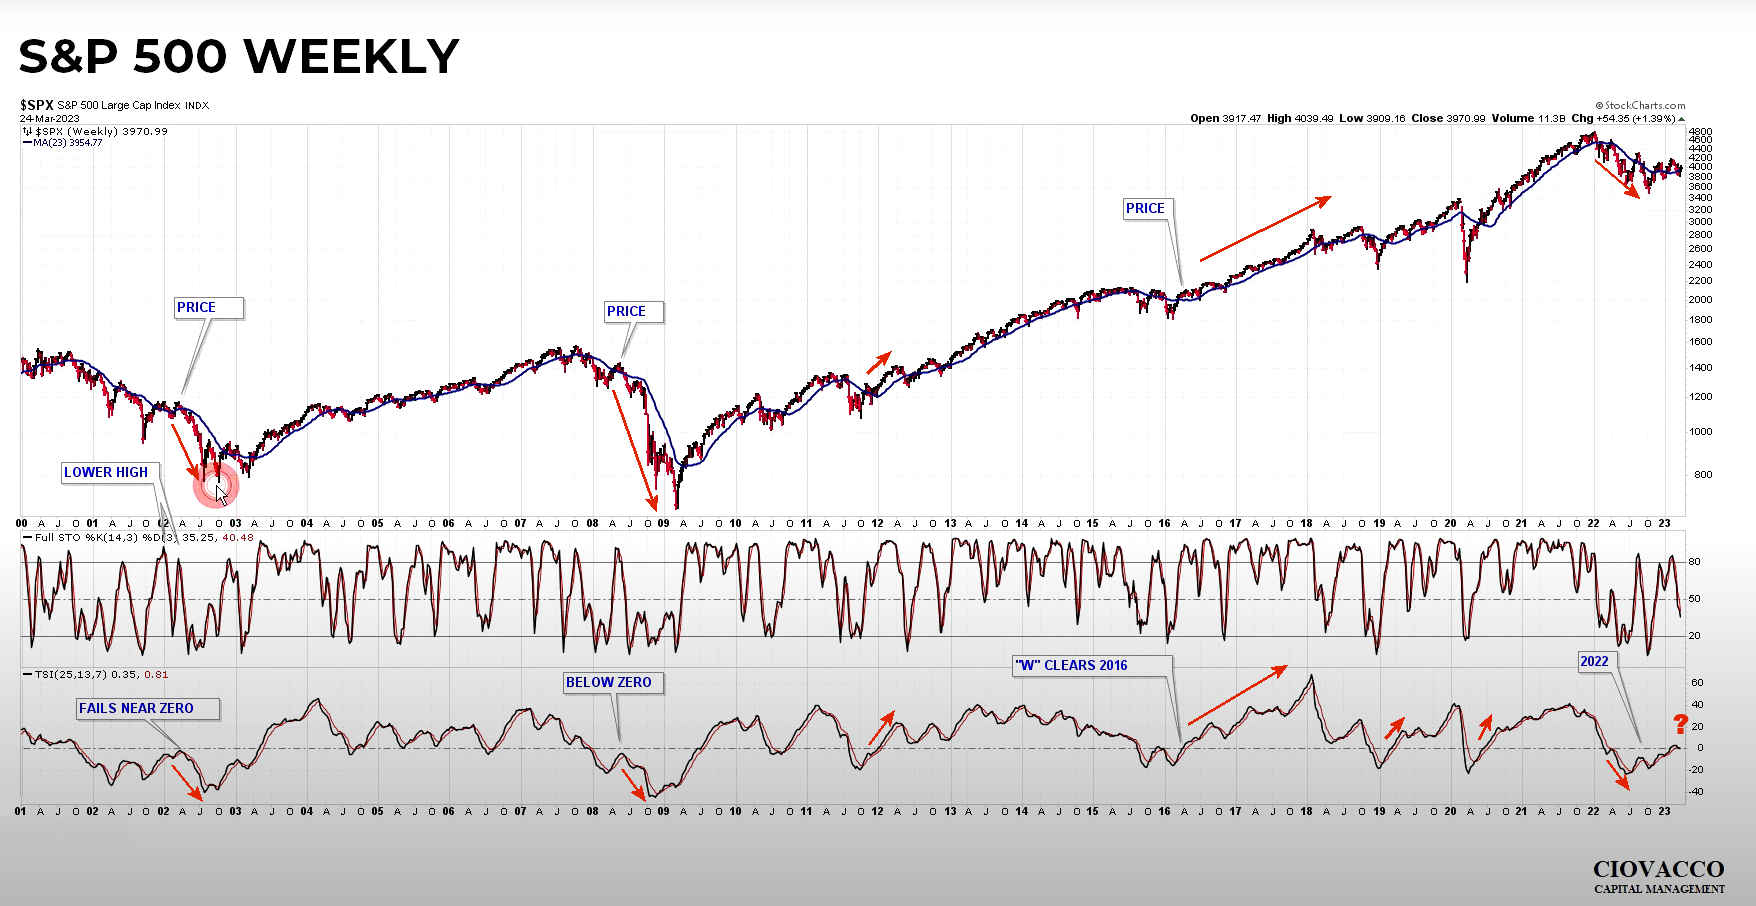
When S&P 500’s TSI turns down after approaching the zero line from below very bad things happen. So if it turns down from here we should be concerned.
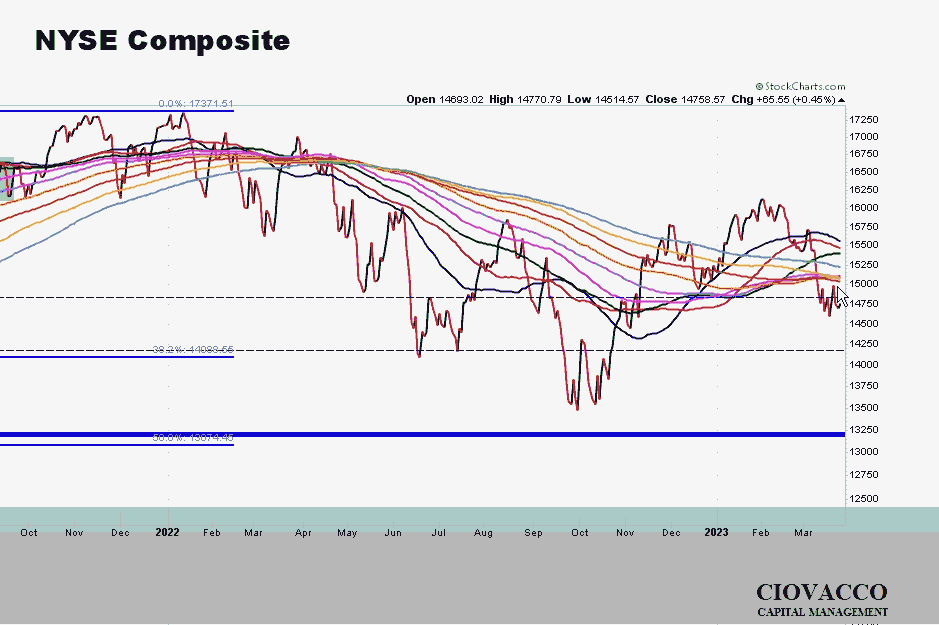
NYSE Composite
The NYSE composite is looking weak (although still not terrible) as it is below all its moving averages and the shorter-term averages are turning down.
Other Take Aways
- Foreign Stocks are developing a more positive look.
- As you’d expect bonds aren’t looking good.
- The look of the Tech sector is improving (not great but improving).
Potential Market Factors
- Severity of Banking Crisis TBD (2008 Different Issues)
- Impressive Move off October Lows
- Weekly Momentum Hurdles Remain
- Like June 2020, Drawdowns Pushing Bullish Envelope
- Coiling/Compact/MA-Convergence Look
- Once Resolved, Move Could be Different from Last 8 Months
- If Bearish, Last Leg Down can be Painful (-34% & -53%)
- 2023 Checks Boxes that 2002 and 2008 Could not Check
- But not by a convincing margin
- Weekly charts may hold the key
- Balance Sheet Expansion is Relevant (But it’s not QE)
- Keep an open mind (neither bull nor bear yet)
- Don’t get stuck on a timeframe
- Markets have countless moving parts
- Nobody has 100% of the relevant info.
See the full video Here