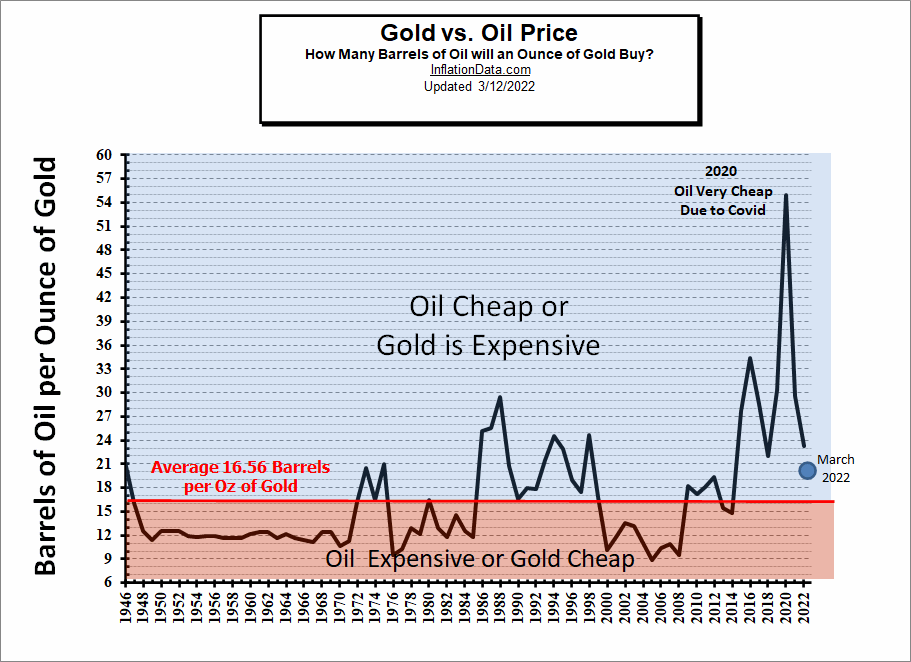
Everyone knows that Gasoline and Crude oil are currently expensive, right? Recently, I updated several of our charts and when I got to the Crude Oil vs Gold chart I was in for a shock. According to that chart, either Gold is expensive or Crude oil is cheap. Oil isn’t as cheap as it was in 2020, but it’s still historically cheap. Actually, it is simply approaching the long-term average ratio (so it’s slightly cheaper than average).
How the Gold vs. Oil Ratio Works
The thinking of the ratio is this… if the value of dollars is constantly changing, the best way to tell if a commodity is expensive is to compare it to other commodities. Historically, gold has been money so what better commodity to compare to?
Looking at the chart of Gold vs. Oil we see that oil is still relatively cheaper than gold. Now as we have said many times Gold is a Crisis hedge so in times of crisis, gold appreciates. Therefore, we would expect gold to currently be expensive and it is, but surprisingly it is not currently at all-time highs.
Read the Full updated Gold vs. Oil Article here.
Inflation-Adjusted Oil Price
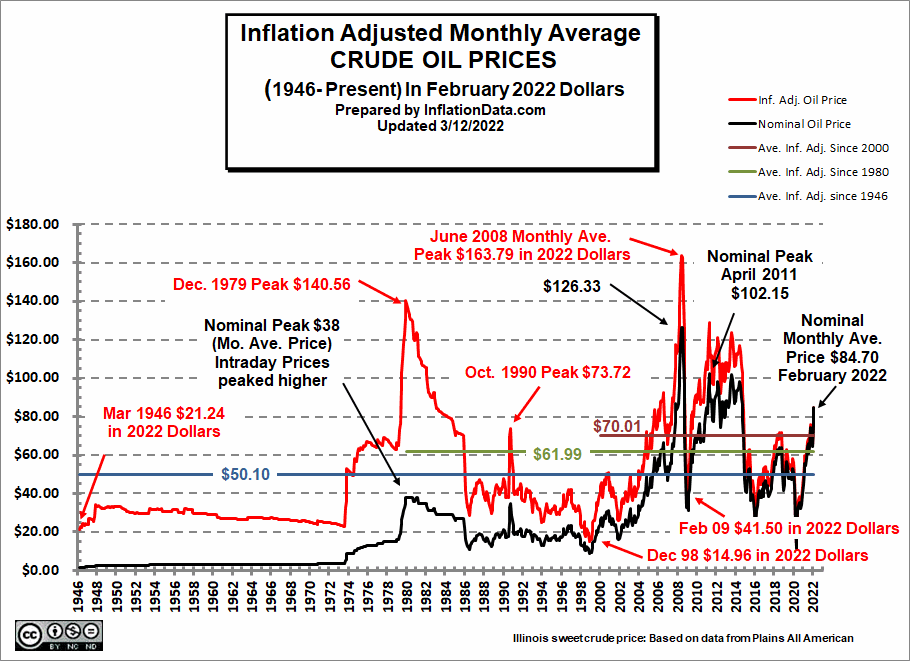
Looking at crude oil prices in terms of the official consumer price index gives us the opportunity to look at oil compared to over 10,000 other products based on the calculations of the U.S. Bureau of Labor Statistics rather than against a single commodity.
The red line on the chart shows Illinois Sweet Crude oil prices adjusted for inflation in February 2022 dollars. The black line indicates the nominal price (in other words the price you would have actually paid at the time). The average price for a barrel of Illinois Crude Oil was $84.70, up significantly from recent lows, and with peak prices above $100/barrel. So, it is well above the $70.01 average since 2000 we can say that oil is relatively expensive. See the Full Inflation Adjusted Oil article here. and the table of oil prices here.
 Inflation Adjusted Gasoline Prices
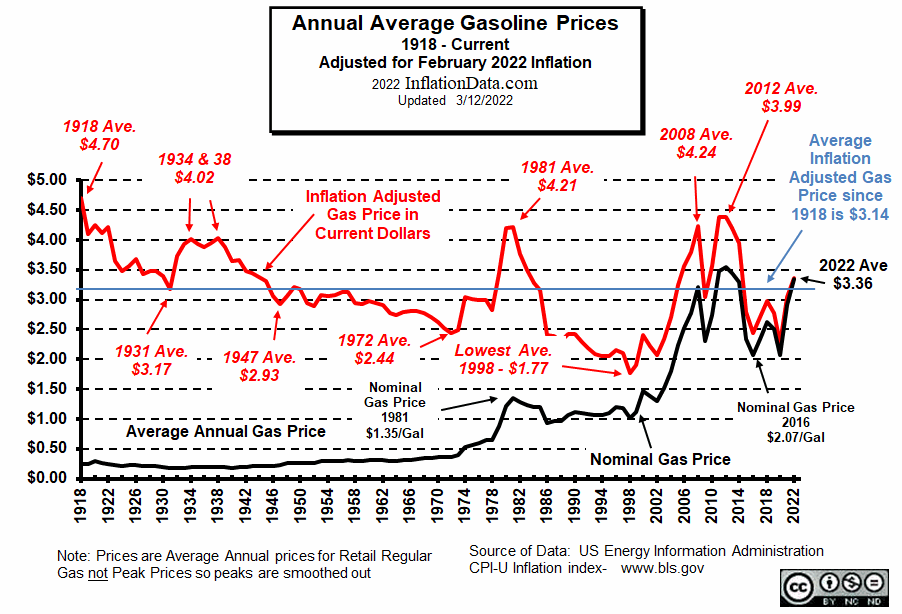
Without looking at inflation-adjusted prices it is difficult to see where gasoline prices actually stand. Back in 1918 gasoline was $0.25 a gallon and by 1932 prices had fallen to 18 cents a gallon! But as we all know over the last 100 years the purchasing power of the dollar has fallen drastically. So, in order to get the true picture, we can’t just say that the lowest price of gas was 18 cents per gallon, we need to adjust the price for inflation. When adjusting for inflation there are two prices… the first is called the “nominal price” and that is the actual price you would have paid for gas at the pump i.e. 18 cents. The key price though is the inflation-adjusted price which calculates what the price would have been if we were spending current dollars on a previous date. In this case, we are basing our calculations on the value of a dollar in February 2022.
See the full article on Inflation Adjusted Gasoline Prices here.
You might also like:
- Annual Inflation Chart
- Gasoline vs. Crude Oil Prices
- Historical Gas Price Chart
- Current Average Cost of Gas by County
- Gasoline Taxes by State
- Average Cost of Gas Per Month
- Calculating Miles Per Gallon
- Regarding Gas Inflation
- Historical Oil Prices Chart
- More Inflation-Adjusted Prices
- Crude Oil and Gold
- Oil, Petrodollars, and Gold


