How Much is the Money Supply Growing?

The “money supply” as described by “M2” includes liquid assets such as Cash, Checking Accounts, Savings Accounts, CDs, etc. But doesn’t include Stocks, Bonds, etc.
Looking at the chart below we can see that the M2 money supply increased gradually up through 1995. Then it began increasing more rapidly for many years until the pandemic when it shot up drastically. Then in 2022 the FED significantly decreased the money supply for the first time. But over the last year or so it appears to be resuming its previous uptrend.
M2 August 2024

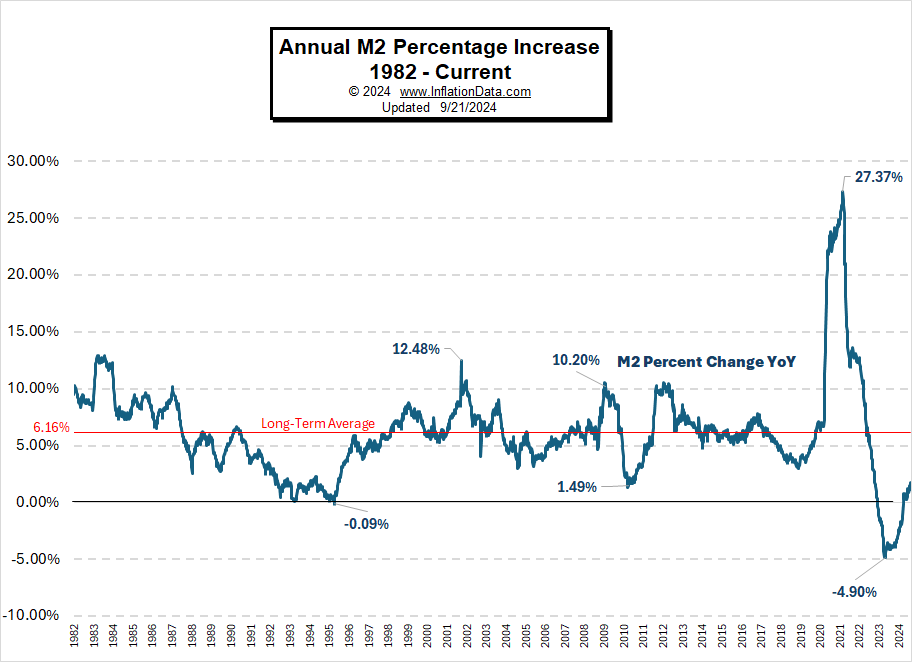
M2 Money Supply on an Annual Percentage Basis

If we look at the money supply on a percentage basis, we get an average annual increase of 6.16% since 1982. But, the actual amount of new currency varies greatly from year to year. The highest increase (on an Annual basis), occurred during the week of 2/22/2021 at over 27%, and about a year later inflation peaked at 9%.

However, despite decreases in the M2 money supply in 2022 and 2023, we did not see deflation in 2023 or 2024 but rather just a decline in the rate of increase, i.e. inflation fell to 2.53% in August 2024.

For the period from 1982 through 1995, the money supply increased by an average of 5.54% per year. From 1996 through 2019 the money supply increased by 6.12%. And in 2020 and 2021 the money supply increased by a whopping 17.73% per year. And from January 2022 through August 2024 the money supply increased by an average of 0.76% per year although in April 2023 the money supply was actually down -4.9% from a year earlier.  By August 2024, the M2 money supply was up 1.71% from a year earlier.
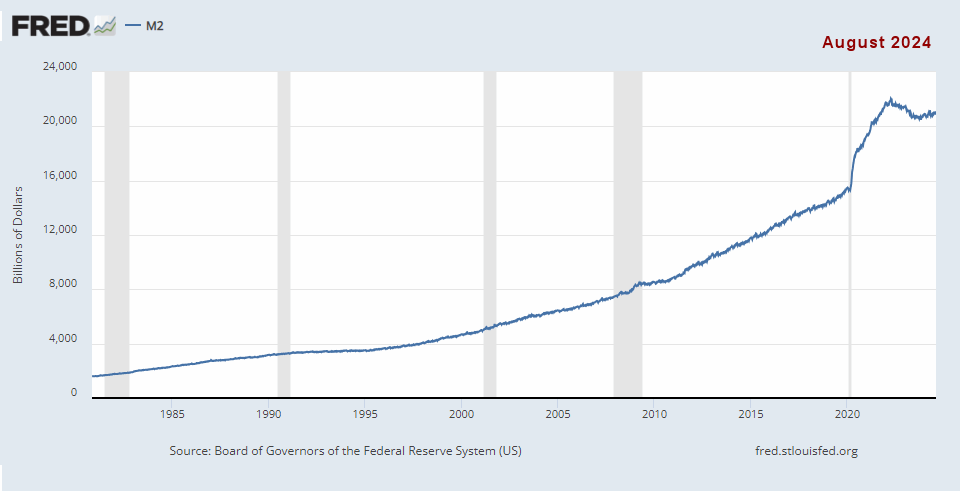
M2 Annual Percent Change 2024
Note: For a single week in April 1995, the money supply was slightly below the year previous, but it didn’t last long before the money supply began increasing again.

M2 in Dollar Terms

In Dollar terms, the Average increase from 1982 through 2019 was 360.4 Billion per year, but by adding in 2020–2023 the average jumped to 455.7 Billion (even with the decreases in 2022 and 2023). As you can see from the table below, the increase in the money supply has not been consistent but varies widely from year to year.
Year M2  Increase in Billions
1982  $                       163.2
1983  $                       206.9
1984  $                       203.9
1985  $                       173.1
1986  $                       246.2
1987  $                         83.9
1988  $                       156.3
1989  $                       169.7
1990  $                       130.2
1991  $                         84.4
1992  $                         54.5
1993  $                         55.4
1994  $                         12.5
1995  $                       150.3
1996  $                       187.6
1997  $                       219.1
1998  $                       342.3
1999  $                       270.4
2000  $                       287.9
2001  $                       518.6
2002  $                       321.9
2003  $                       288.8
2004  $                       366.4
2005  $                       258.4
2006  $                       401.1
2007  $                       403.3
2008  $                       749.6
2009  $                       263.0
2010  $                       347.7
2011  $                       839.4
2012  $                       901.5
2013  $                       512.6
2014  $                       661.4
2015  $                       663.3
2016  $                       843.0
2017  $                       638.4
2018  $                       595.1
2019  $                       922.9
2020  $                    3,829.7
2021  $                    2,462.3
2022  $                      (315.2)
2023  $                      (530.3)

You might also like:

Leave a Comment

Your email address will not be published. Required fields are marked *

This site uses Akismet to reduce spam. Learn how your comment data is processed.

Scroll to Top