Timing the Crypto Market
 Using our ROC (Rate of Change) system to look at the two biggest cryptocurrencies, i.e., Bitcoin and Ethereum gives us a unique insight to these Crypto Currencies. Our charts are now using the weekly prices so we can get a bit more precise timing.
So, let’s look at Bitcoin first. Bitcoin is EXTREMELY volatile, so the first thing we had to do to adapt it to the ROC analysis was to smooth out some of the volatility by using averages. Also, because Bitcoin has increased so rapidly since its inception we are plotting it on a “Logrithmic” scale. That means that the distance between every horizontal line is 10x bigger than the previous one. If we didn’t do this the early line would look flat in the beginning and the last part of the chart would shoot straight up. By using the logarithmic scale we can see much more detail in the early chart.
We averaged the ROC index to smooth out the bumps so it wasn’t crossing its red moving average lines 100 times. What we came up with was nice distinct crossings and a nice cyclical pattern. BTC is known for its cyclical nature due to the intrinsic code that created it. It is also to a great extent, outside the influence of government manipulations and this results in a much cleaner pattern. Historically, Bitcoin has had a 4-year cycle, with three years up and one year down. Despite Bitcoin’s massive drops, had you bought at any point during BTC’s history (even intermediate peaks) and held for 4 years, you would have made a profit.
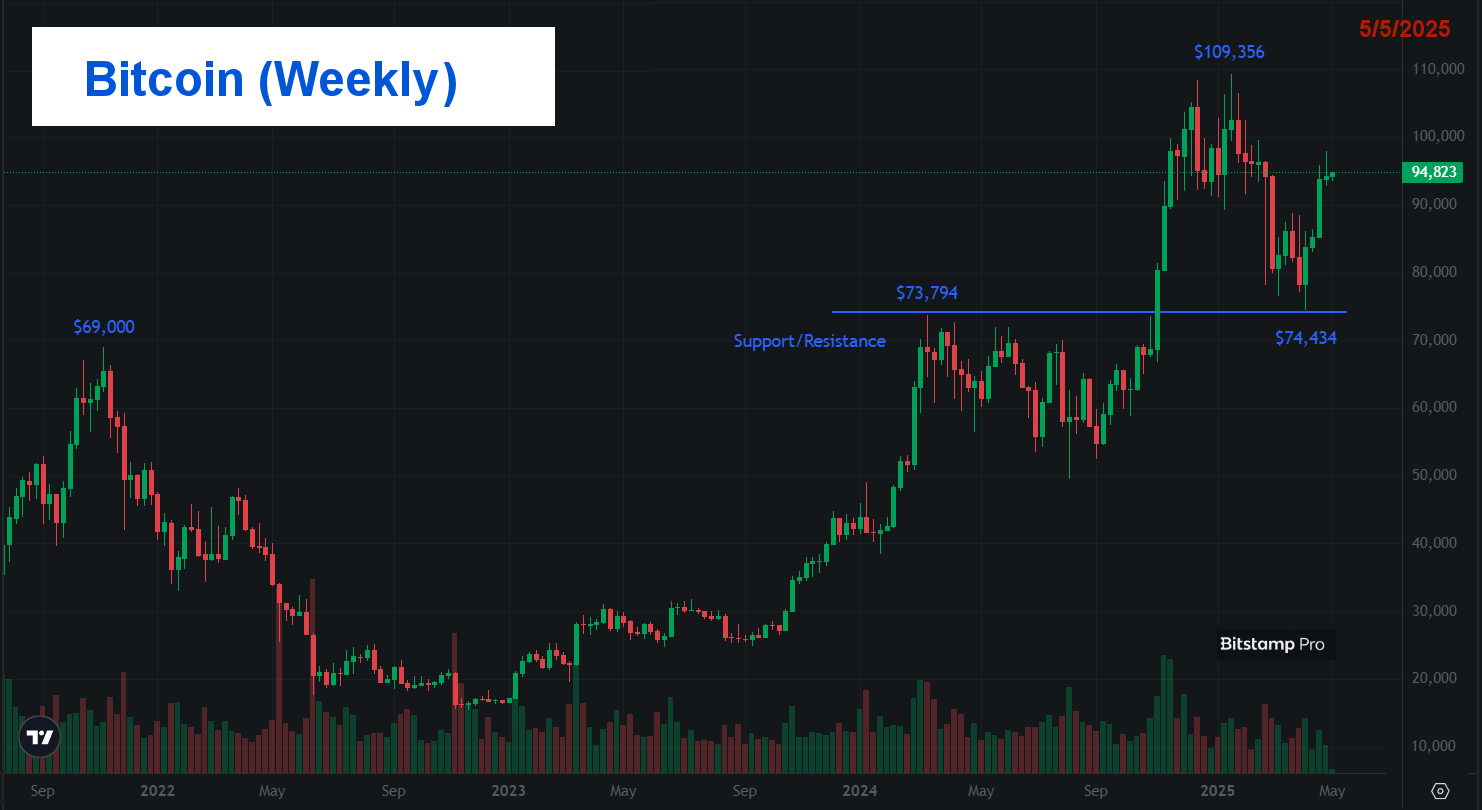
IN early March 2024, Bitcoin peaked at $73, 794 well above the previous peak of an even $69,000 in 2021. This established a new resistance level that held for over 9 months. During that time, Bitcoin tested that level several times while it consolidated. And then in typical style, it blasted through and went on to make a new high at $109,356. and drifted sideways for a while before recently testing the $74,000 level for support. That support appears to have held, as BTC has rebounded to around $95,000 again. Note: Even if the wick of the candle had gone below the line, as long as the week closed above the line, support would be considered intact. Also of note is that the support line is above the previous 2021 high of $69,000, indicating that the long-term trend is also still intact.
If BTC follows the 2024 pattern, we could see a few more months of sideways movement before another meteoric rise. But…
BTC vs. Global M2
Bitcoin tends to follow the Global M2 Money supply with a lag of between 75 and 108 days. In the following chart, we have shifted the Global M2 (yellow line) 85 days forward, so we can see what is ahead for Bitcoin if it continues to follow the money supply. As we can see, during Bitcoin’s consolidation period in 2024 the global money supply was also flat. Then, when the money supply rose sharply, Bitcoin followed. And in 2025, when the global money supply contracted, Bitcoin fell. Now the money supply is expanding again and it looks like Bitcoin is following. So, rather than a long consolidation, BTC could be headed higher now.
Bitcoin (BTC)
Sell Signal
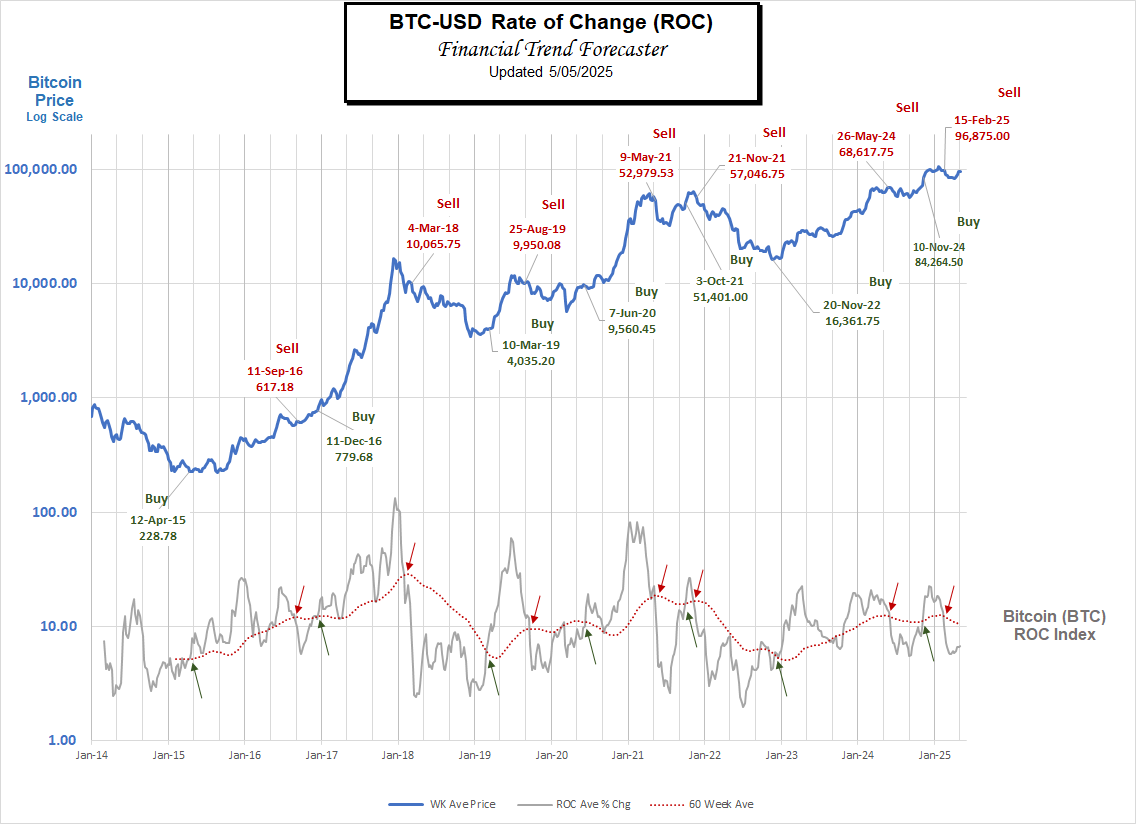
Unfortunately, the ROC chart hasn’t generated a buy signal yet.
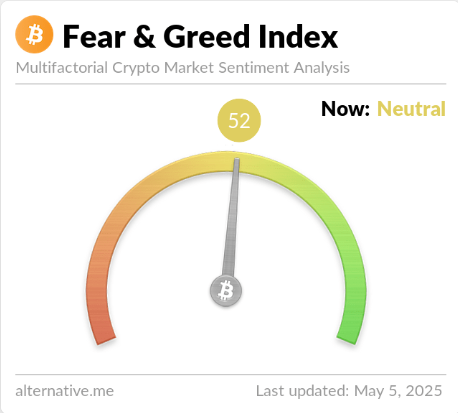
Fear & Greed Index
Based on Warren Buffett’s axiom “Buy when others are fearful and sell when others are greedy,” analysts have developed various fear and greed indicators for Bitcoin. This has proven a good indicator of when to buy, i.e., when the “Fear and Greed Index” is solidly in “Fear” territory. That occurred on March 10th at an “Extreme Fear” reading of 15, and once again on April 8th at the same level. Fear and Greed is currently in Neutral Territory, still well below the sell point of extreme greed. If governments begin stacking Bitcoin in their strategic reserves, almost any point is a good buy point since BTC could easily quadruple over the next 5 years.
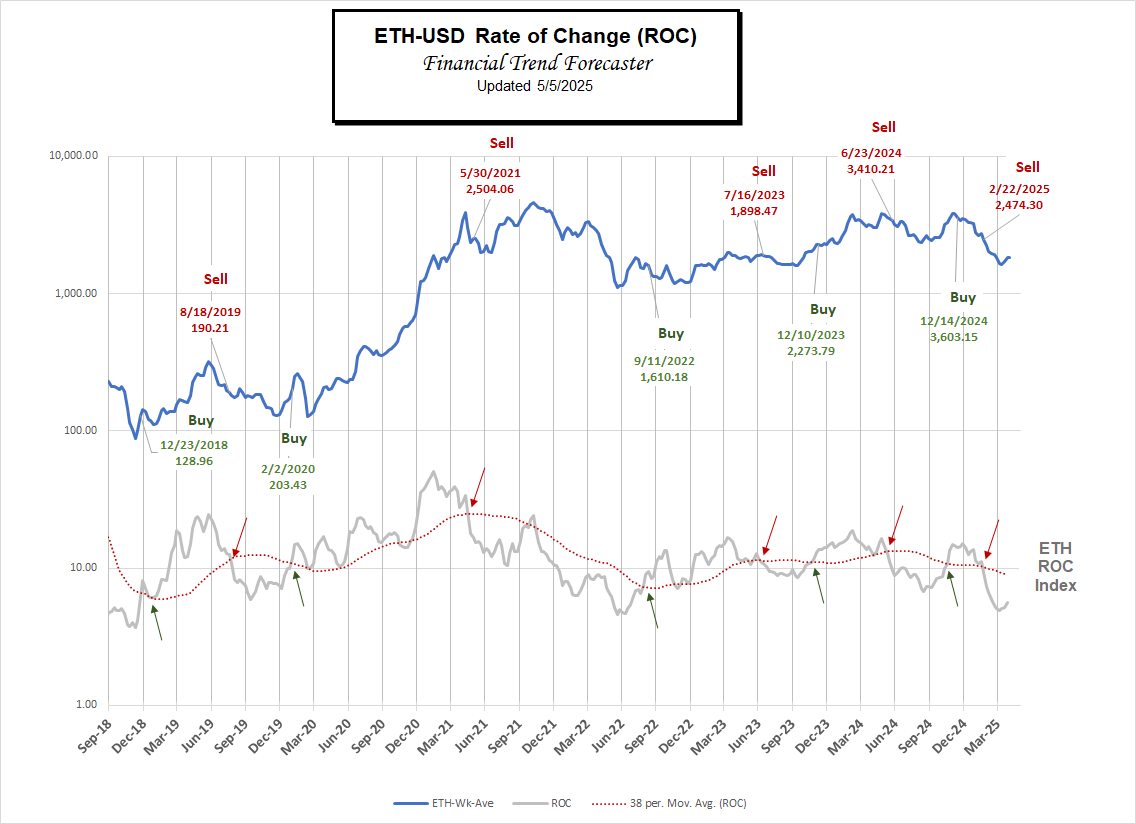
 Ethereum (ETH)
Sell Signal
Bitcoin itself opened the floodgates for Crypto and decentralized finance (defi), but BTC functions almost entirely as an alternative currency. Ethereum has built on that foundation and is much more functional. Rather than being strictly a currency, Ethereum allows applications to be built upon its code to enable almost anything you can imagine to be done in a decentralized fashion. This makes ETH even more useful than BTC.
The one difference is that there is a limited supply of BTC built into the algorithm, but the same limitation is not built into ETH. But ETH does contain supply-limiting factors, which include “burning ETH” when it is used to provide services. So, when demand for ETH is high, the price rises. However, some recent changes to ETH to enable layer 2 have temporarily created some lower profitability for ETH.
Looked at simplistically, ETH is useful, and BTC is scarce. Recently, the FTC has determined that both BTC and ETH are “Commodities,” so we can think of them like the electronic versions of Silver vs. Gold, or perhaps even better, Copper vs. Gold. Just as Copper is necessary for all sorts of building, and Gold is a store of wealth, ETH is becoming necessary for electronic transactions, and BTC can be used as a store of wealth.
But ETH has suffered during this cycle as it faced competition from Solana, and it shifted its revenue model to allow for Layer 2 protocols to handle some of the load in order to increase transaction speed. I believe that at some point, ETH will recover its lost lustre as its usefulness becomes more apparent, but there is no guarantee when that will happen.
 Crypto Stocks
There are several ways to invest in various cryptocurrencies via the stock market. Recently, there have been Exchange Traded Funds (ETFs) created for Bitcoin. And subsequently, an Ethereum ETF was created, giving both cryptos access to increased liquidity. Recently, several of the big investment companies like BlackRock and Schwab have been rumbling about creating ETFs for other cryptos like Solana (SOL), Ripple (XRP), and Cardano (ADA).
Prior to ETF approval, a company called Grayscale has created “Trusts” that own a fixed amount of various cryptos and then sell shares of the Trust. Unfortunately, those shares often cost more than the underlying value of the assets the Trust held, often many multiples of the cost. For instance, at one point, Grayscale Solana Trust (GSOL) had a Net Asset Value (NAV) of $50.56/share. But it was selling for a whopping $425.00/share. That is absolutely insane. That would be like me walking up to a guy on the street and saying I have this beautiful $50 bill, and I will let you have it for only $425. No thanks!!!
But occasionally, it works the other way around when market sentiment turns negative. For instance, on 7/7/2024, there were three Grayscale funds that were selling at a discount. They were Grayscale Ethereum Trust (ETHE), Grayscale Ethereum Classic Trust (ETCG), and Grayscale Digital Large Cap Trust (GDLC). You can view all the current Grayscale NAVs and current prices here.
Another way to invest in Crypto besides an ETF or a Trust is through a company that holds a significant portion of the assets on its balance sheet in Crypto. The biggest example is Microstrategy, which we discussed at length in our article What Makes Microstrategy Special.
Coinbase is the largest Crypto Trading platform in the U.S. It works like a brokerage account and offers trading of a large selection of cryptos. You can find more information about it here. (Follow our link for signup bonuses and incentives.)
You might also like:
- Bitcoin Breaks Out
- The Modern Day Wild West: Crypto Scams And Opportunities
- Blockchain Goes to Ethiopia
- Ripple the Cryptocurrency of Banks
- 4 Investments Making Waves in the Technology Sector
- How High Inflation Drives Countries Towards Crypto
- Can Crypto Solve Venezuela’s Hyperinflation Problem?
- Cryptocurrencies and Inflation
- Cryptocurrency: Is Bitcoin the Future of Money?