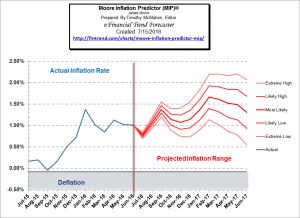
On Friday July 15th, the U.S. Bureau of Labor Statistics(BLS) announced that the Consumer Price Index (CPI-U) had increased from 238.638 in June 2015 to 241.038 in June of 2016 resulting in a 1% Annual inflation rate. InflationData calculated the rate to be exactly 1.01% down marginally from 1.02% the previous month. However, on a seasonally adjusted basis monthly prices rose 0.2% overall while food fell -0.1% and energy rose 1.3%
The BLS’ Commissioner’s Report stated “For the second consecutive month, increases in the indexes for energy and all items less food and energy more than offset a decline in the food index to result in the seasonally adjusted all items increase.” In other words, even though food fell in price, everything else (including energy) rose so the net effect was a 0.2% increase in the Consumer Price Index (on a monthly Seasonally Adjusted basis) and 0.3% on a non-adjusted basis.

See full commentary on the MIP here.
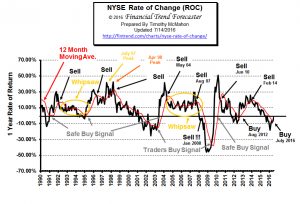
NYSE ROC

Read Full Commentary.
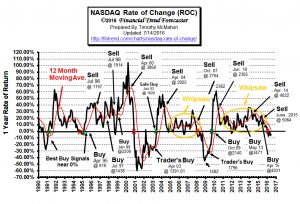
NASDAQ ROC

