Forecasting Inflation: Using the Moore Inflation Predictor©
By Tim McMahon, editor
 The Moore Inflation Predictor© (MIP) is a highly accurate graphical representation designed to forecast the inflation rate. By watching the turning points, we can profit from inflation hedges (like Gold, Real Estate, and Energy Producers) when inflation is trending up. And from Bonds when the inflation rate is trending down. See the Current Commentary below.
In addition, the Moore Inflation Predictor forecast can be used to judge whether to lock in a mortgage rate or wait a month or two for a better rate since interest rates tend to track inflation rates fairly closely.
Don’t miss next month’s Moore Inflation Predictor MIP Inflation Forecast!
Sign up for our Free E-zine, and we will notify you when the new Charts are released!
Yes, Notify Me when the new inflation forecast or article comes out!
Updated April 11, 2026
Previous Moore Inflation Predictor (MIP) Projections
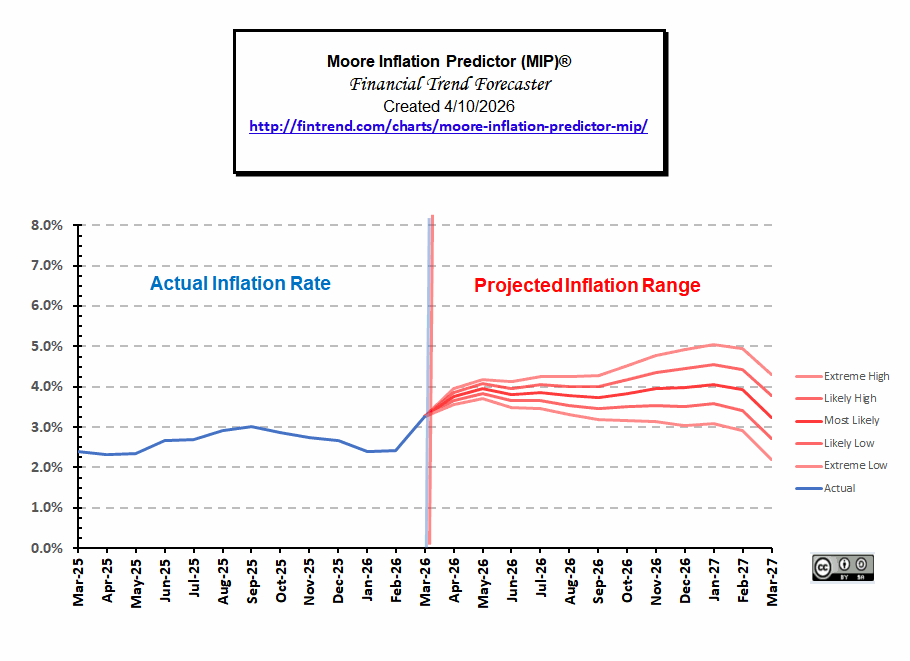
This is our MIP inflation projection chart from a year ago, with what actually happened in blue. As you can see, the actual line almost exactly tracks our “Most Likely” projection for the 4th quarter.
Unfortunately, the MIP is unable to predict events like wars, pandemics, and political theater, so it drastically underestimated March inflation. It is interesting to note that inflation probably would have been up slightly even without the war. 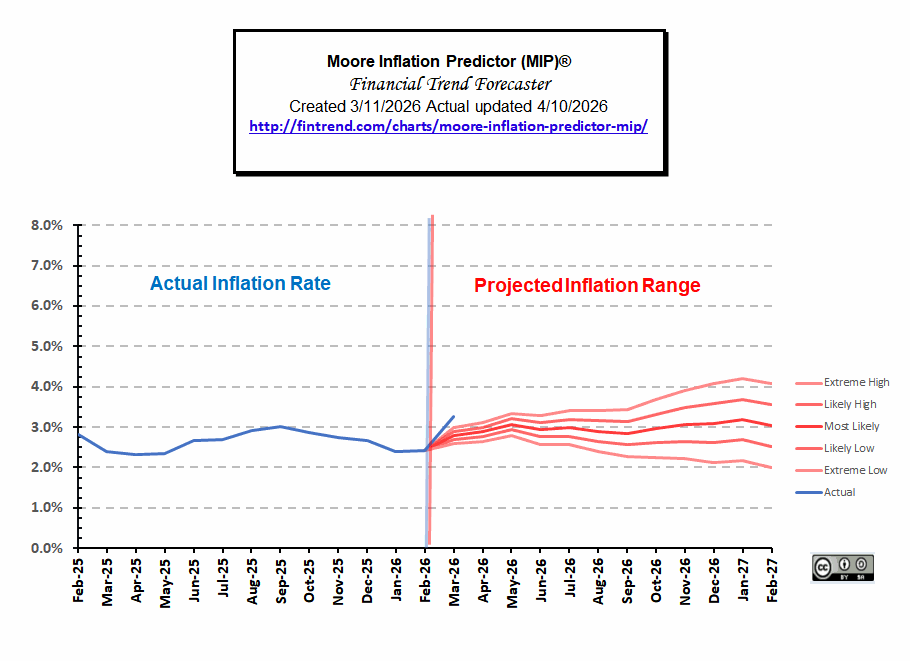
The following chart is our projection for this month, indicating that inflation will probably be up for the next month, and depending on what happens in the “Straits of Hormuz,” it could be much higher.
Inflation becomes more likely as the FED has stopped its monetary tightening (QT) and is lowering rates and pursuing “higher liquidity” via “Reserve Management Purchases” (RMPs), aka. QE-Lite:
- Roughly $40B in T-bill purchases in the first month
- All principal payments reinvested into T-bills
- Authorization for more short-maturity purchases as needed
On the other hand, IF AI continues to accelerate at the pace it has been, that could be a MASSIVE DEFLATIONARY force, and we could see inflation lower. The drop in inflation indicated at the end of the chart represents the possibility of oil prices returning to normal, and March 2026’s high monthly numbers falling out of the equation.
See FED Actions and How FED monetary policy affects Inflation
MIP Accuracy
Inflation has had a wild ride over the last 20 years. In July 2008, inflation was at 5.6%, but only a year later, it had fallen to a negative -2.10%, a fall of 7.7% in twelve months. Six months later, by January 2010, it was back at 2.63%. But it spent most of the end of 2010 around 1.15%, coinciding with a low in mortgage rates of about 4.55% in November. Due to QE1 & 2, by August 2011, the inflation rate had worked its way up to 3.77%. But from then through July 2012, both inflation and mortgage rates fell, with Inflation hitting 1.41%. And mortgage rates falling below 3%. From 2017 through early 2020, you would think the Central Planners actually knew what they were doing… as inflation hovered around their 2% target. But then in May of 2020, annual inflation bottomed at 0.12%, and 2 years later it was over 9%.
You would think forecasting the inflation rate would be difficult under those conditions, but the Moore Inflation Predictor did fairly well (except on a couple of rare occasions).
In the following chart, we can see how the Moore Inflation predictor has done over some of the crazy years we’ve just been through. The first chart is from April 2010 based on the March 2010 data. This chart was created in the midst of a Deflationary panic (thus the hypothetical thin blue line). Even though there was a sharp drop in the inflation rate, the MIP did a good job of forecasting it, as the actual (thick blue line) shows. The actual inflation rate tracked the extreme low almost exactly and held it consistently for nine months. In the tenth month, inflation moved back into the most likely territory.
Jump to Current Inflation Forecast
Previous MIP Charts

The Moore Inflation Predictor chart from December 2011, shows the blue reality line added ten months later in September.

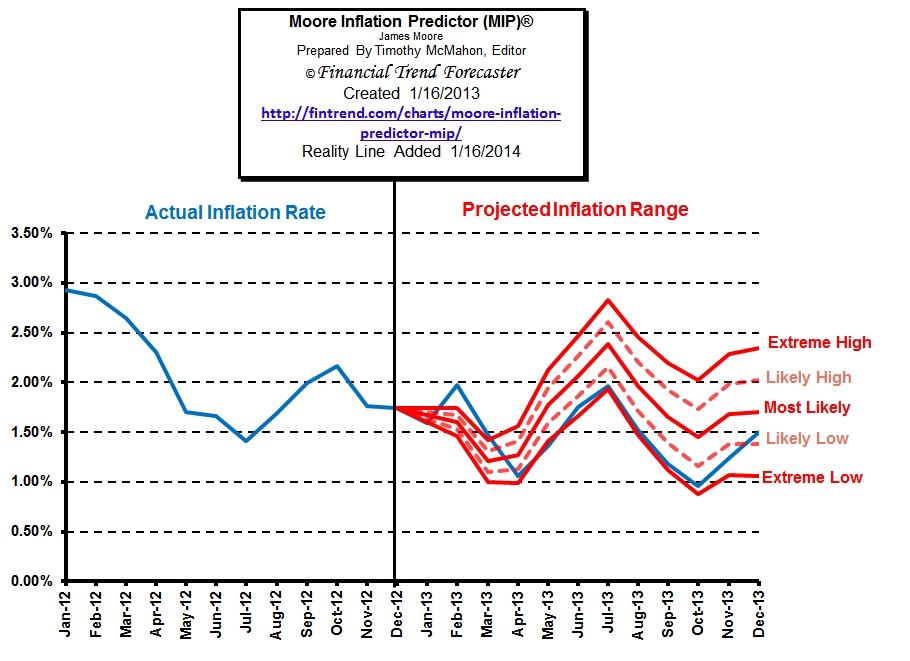
On this chart from January 2013, we can see that the actual inflation rate has tracked the extreme low prediction almost precisely. This fits well with the fact that Inflation has been lower than most economists and even the FED have expected. The one exception is Robert Prechter, who has been touting Deflationary pressures. You can get Robert Prechter’s 90-page deflation survival guide free here.
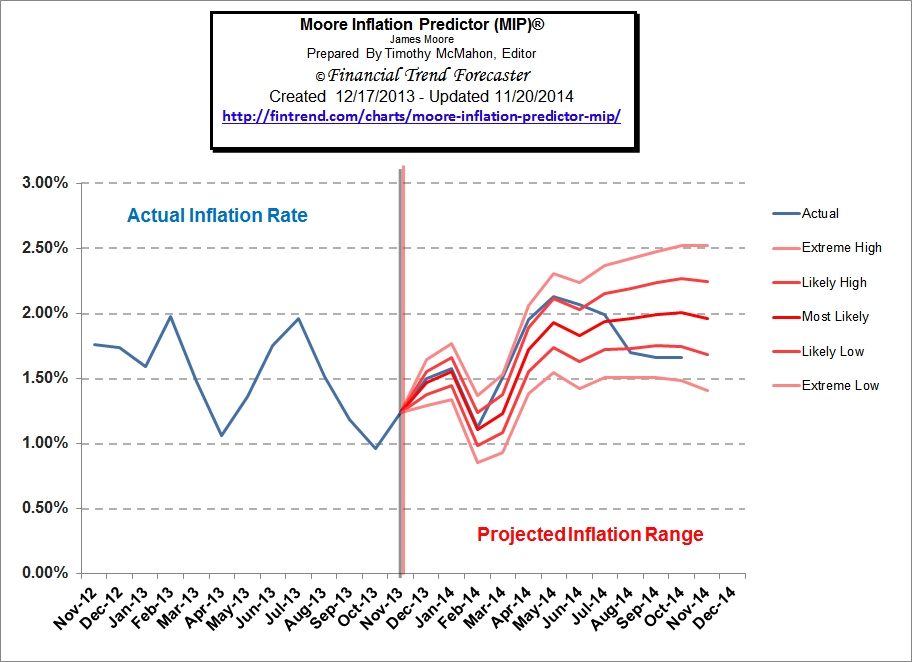
This Moore Inflation Predictor chart is from December 2013, with the blue reality data line added through October.
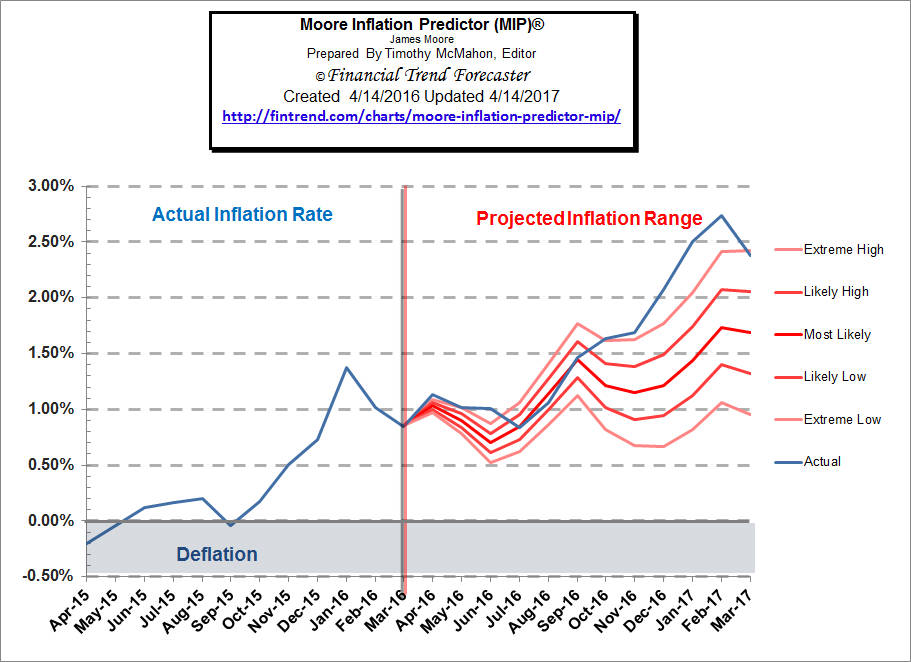
This chart shows the projection from March 2016 with the reality line through March 2017. For the first six months, the MIP did pretty well, but then the actual inflation rate took off like a rocket, zooming above our extreme high projection and then, at the last moment, falling back into the zone.
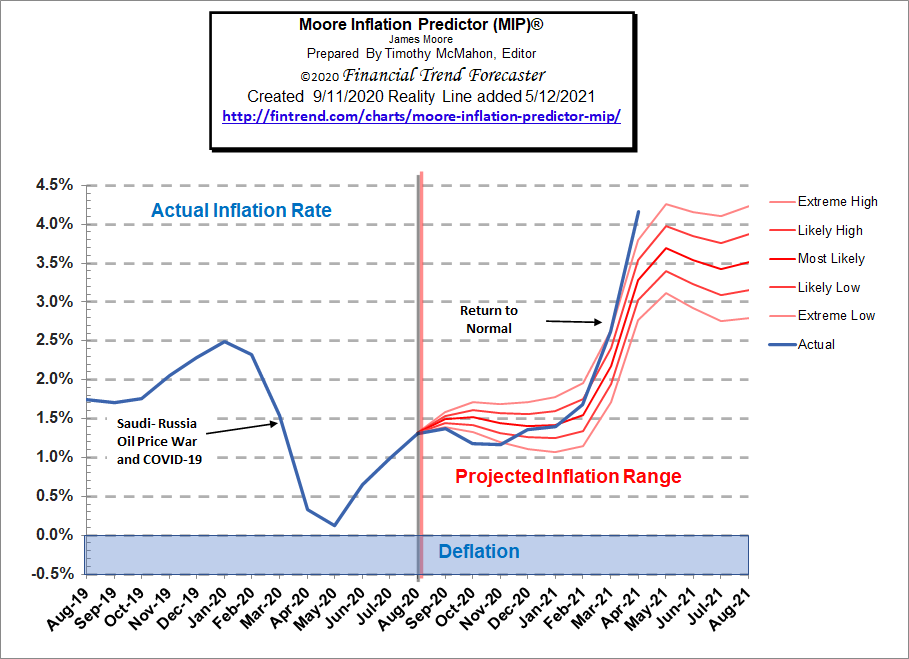
Back in September 2020, we created this chart projecting a massive spike coming in March and April. Up through March, the projection was pretty close, with December through February tracking almost exactly on the “most likely” line. But April overshot even our high projections.
 To see how well the MIP has done in predicting inflation, see some other previous MIP inflation forecasts with a reality line added.
Annual Inflation Chart
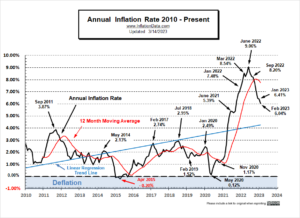 We’ve updated the current annual inflation chart, which shows the Current Annual Inflation Rate starting in 1989. Over the months since the June 2014 peak in the CPI index, we have had twenty-seven months of monthly deflation (annual disinflation), i.e., where prices were slightly lower than they were the previous month. This typically happens a few times every year (generally in the 4th quarter), but in 2014, prices began falling during the summer, indicating growing deflationary forces due to FED tapering (i.e., not inflating as much). This resulted in six months of annual deflation (not just monthly), where prices were actually lower than they were 12 months prior. In early 2017, inflation increased, indicating that these deflationary forces had abated. But over May and June, inflation began falling again, with a bit of an upturn in July through September.
In 2020, lower energy prices due to the Saudi-Russia Oil Price War and decreased demand due to the COVID-19 virus shutdown drove March and April’s monthly inflation rates down to -0.22% and -0.67%, respectively. Typically March and April are some of the most inflationary months of the year, so this is very rare. The last time we had negative monthly inflation in a March month was in 1982 and 1986. Prior to that, we have to go all the way back to 1948 to find one. April had negative monthly inflation in 2013, 2003, 1986, 1954, and 1939. Note that only in 1986 were both months negative.
In 2022, we had four negative months to counteract the extremely high first half of the year, i.e., July, August, November, and December.
See the Annual Inflation Rate Chart for more information.
Inflation Seasonality:
There are some reasonably consistent seasonal trends. The first quarter of the year has most of the inflation, while the last quarter of the year is generally flat to deflationary. As a matter of fact, in the months since January 1950, there have been 25 negative months from January through June (two in 2020) and 73 negative months in July through December. So it appears that the majority of inflation occurs in the first half of the year and then moderates for the second half. One possible explanation is that during the fourth quarter, many stores hold massive sales (think Black Friday) to reduce inventory before year-end for tax reasons.
If we look at only October, November, and December, from January 2000 through 2019, there have been 13 deflationary 4th quarters and only seven inflationary 4th quarters. This is fairly amazing since the overall trend has been toward inflation. In 2008, the fourth quarter was -3.91%. This was definitely not typical, and due primarily to the liquidity implosion… but on the other hand, even though 2006 was a boom year, it still had a negative fourth quarter of -0.54%. The average for all the 4th quarters since 2000 was a deflationary -0.48%.
But in 2020, rather than a negative quarter, we had very slight inflation. October was 0.04%, November was -0.06%, and December was 0.09% for a total of 0.7%. Not massively high, but not negative either. Could this be a sign that inflation is starting to pick up?
Inflation + Unemployment = The Misery Index
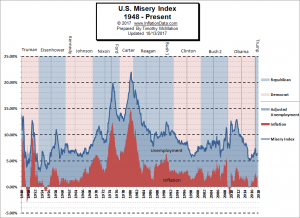 Both high inflation and high unemployment tend to make life rough for families trying to make ends meet. Back in the 1960’s, economist Arthur Okun found a quick and dirty way to measure the pain caused by these two factors. He simply added their percentages and called it the “Misery Index”. For more information, see the Misery Index.
The History of Quantitative Easing
On June 20th, 2012, the Federal Reserve decided that the recovery was stalling. So they voted to expand its “Operation Twist” program by swapping $267 billion in U.S Treasury securities by the end of 2012. Previously, “Operation Twist” was set to end in June. And then, on September 13th, In an 11–1 vote, the FED decided that QE3 was necessary, and they decided to launch a new $40 billion per month, open-ended bond purchasing program of agency mortgage-backed securities. According to NASDAQ.com, this is effectively a stimulus program that allows the Federal Reserve to relieve $40 billion per month of commercial housing market debt risk. On 12 December 2012, the FOMC announced an increase in the amount of open-ended purchases from $40 billion to $85 billion per month.
On 19 June 2013, Ben Bernanke announced a “tapering” of some of the Fed’s QE policies contingent upon continued positive economic data. Specifically, he said that the Fed could scale back its bond purchases from $85 billion to $65 billion a month during the upcoming September 2013 policy meeting. But due to the poor economy, at its September 2013 meeting, the Fed decided to hold off on scaling back its bond-buying program. But between then and March 2014, the Fed had tapered purchases down to $55 billion per month in three $10 billion cuts. At the March FED meeting, they decided to cut mortgage bond purchases to $25 billion from $30 billion and Treasury purchases from $35 billion to $30 billion a month. Tapering continued down to zero in October 2014, at which point the FED began discussing raising interest rates.
According to CNBC’s Robert Frank, a Bank of England report shows that its quantitative easing policies had benefited mainly the wealthy and that 40% of those gains went to the richest 5% of British households. Dhaval Joshi of BCA Research wrote that “QE cash ends up overwhelmingly in profits, thereby exacerbating already extreme income inequality and the consequent social tensions that arise from it”. Anthony Randazzo of the Reason Foundation wrote that QE “is fundamentally a regressive redistribution program that has been boosting wealth for those already engaged in the financial sector or those who already own homes but passing little along to the rest of the economy. It is a primary driver of income inequality”.
For further information, see the Current Commentary on the Annual Inflation Chart.
Note:
Being a mathematical inflation forecast, the Moore Inflation Predictor (MIP) has no way to factor in things like Gas prices, monetary expansion, actions by China, natural disasters, Stock market crashes, etc., until it starts showing up in the current numbers, so we must be alert for these type of events.
Remember, it takes 1 to 2 years for monetary stimulus to result in inflation, depending on the money multiplier and other factors. See Velocity of Money and Money Multiplier – Why Deflation is Possible for more info.
Is there a correlation between inflation and the stock market? This chart compares decade inflation and stock market returns during the decade.
Tim McMahon, Editor
Financial Trend Forecaster
At Financial Trend Forecaster, we are not registered investment advisers and do not provide any individualized advice. Past performance is not necessarily indicative of future performance, and future accuracy and profitable results cannot be guaranteed.
Note: We provide links to some of our favorite commentary, and although we don’t always agree with them, it is always insightful, and therefore, we believe it is beneficial information to share. Sometimes these partners will offer you free trials or other valuable bonuses. In some cases, we may receive a commission if you use our links to their site. We assume you will use this information wisely and determine its benefit based on your own circumstances. We do not know your situation, but we hope you will find the information useful in making your own informed decisions.
Don’t miss next month’s MIP Inflation Forecast!
Sign up for our Free Monthly E-zine, and we will notify you when the new Charts are released!
Yes, Notify Me when the new inflation forecast chart comes out!
in real terms how much will usd 2,237,265 be worth 25 years from now .
To be precise if a client takes a policy out today –saving usd2000 every month for 25 years –allowing for inflation-what will it’s true value be 25years hence.
thank you
Kevin
There is no way to know for sure what the future inflation rate will be. The average inflation rate since 1913 is 3.14% but some periods had very high inflation like the teens and the 70’s and others had very low inflation like the last few years. But a safe estimate would be an average of 3.2%. Using this calculator: http://www.buyupside.com/calculators/inflationjan08.htm we see that $2237265 today would only have the purchasing power of $1,017,946.60 25 years from now. A good rule of thumb is that it losses roughly half of its value in 20 years.
I want to forecast monthly inflation rate. I was searching for a model where inflation rate can be projected using previous years data for inflation and its indicators without setting values of any of these arbitrarily in he model. Can any one help me assisting the technique of forecasting inflation in Moore Inflation Predictor? If currently government has planned to increase the money supply in private sector and to reduce it in public sector, how can I forecast inflation?
Thanks in advance.
So, where’s the latest? July should be available, right?
CPI data for July will be released by the BLS tomorrow (i.e. August 10th). If you sign up for our eTrends Newsletter we will notify you when new articles are posted and when charts are updated.
Thanks for the Great post! Is there a link that shows the methodology for the Moore inflation predictor? I’d be interested to see it. Thank you, Matt.
Matt,
The MIP starts with the fact that there are 12 monthly components to the annual inflation rate. Looking at every month in the future we know the following: Next month we already know 11 of the 12 components, the following month we know 10 of the components, then 9 and so on.
Next we have to estimate the various unknown elements. For next month, all we have to do is estimate the one unknown component, so the range is relatively narrow.
We create our estimates using a variety of factors, including the mean, median, high and low for that particular month over the last 10 years. We also factor in the season because January through May or June tends to be higher, then through September inflation tends to be moderate, and the 4th quarter tends to be low or even negative. Once we have all the estimates we put them together to form a chart. Hope this helps!