Mark Thornton and Ryan McMaken discuss the current yield curve inversion. The U.S. Treasury funds deficit spending by issuing debt instruments with a range of maturities. Treasury Bills have maturities from one month to one year. Treasury Notes have maturities from two to ten years. And long-term debt is issued as Treasury Bonds with 20- and 30-year maturities. The yield curve is created by comparing interest rates between ten-year debt to 3-month debt. Logically, long-term debt should require a higher interest rate than short-term debt simply because a lot can happen in ten years so there is more uncertainty, i.e., risk.
An inverted yield curve occurs when long-term interest rates are less than short-term interest rates. Typically, an inverted curve has been a reliable indicator of an upcoming recession. – In the following article Ryan McMaken looks at the current inverted yield curve and is a short summary of the content of the content of his podcast ~Tim McMahon, editor
The Yield Curve Is Now In The Deepest Inversion Since 1981
by Ryan McMaken
The most recent inversion of the yield curve is no small or minor inversion, but is an inversion deep into negative territory. This, Thornton notes, gives us good reason to expect a serious economic event, whether a recession or even a full-blown economic crisis.
How big is big when it comes to the latest inversion? To measure the magnitude of the inversion, a time series of the gap between the yields on a long-term and a short-term is calculated. The most common-used measure of this is the gap between the 10-year Treasury and the 3-month Treasury. If we graph this difference between the 10-year and the 3-month, we can see that we’re now experiencing the largest inversion in more than 40 years [since 1981]:
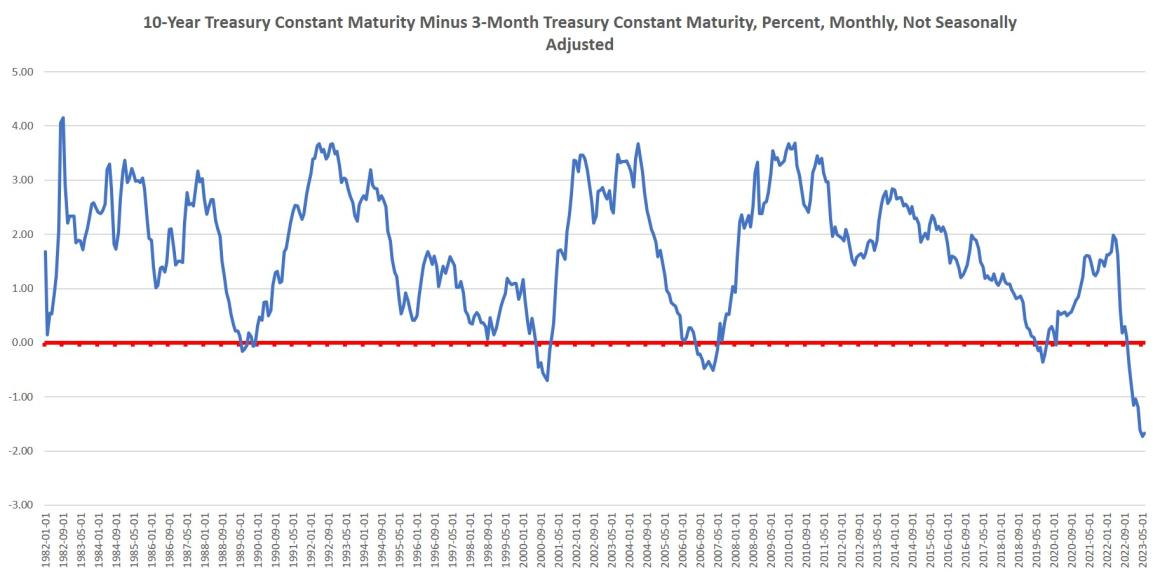
In June, the average gap was -1.67. That’s far deeper into negative territory than anything we’ve seen since 1981, 42 years ago. As we noted on the podcast, these sorts of inversions have reliably preceded recessions for several decades. As we can see in this graph that takes a longer time frame going back 50 years, the recession of the 1970s and the 1980 recession and the severe 1981-1982 recession were all preceded by a yield curve inversion. Moreover, to find an inversion deeper as the current one, we have to go back to 1980.
The following chart includes recessions (shaded areas):
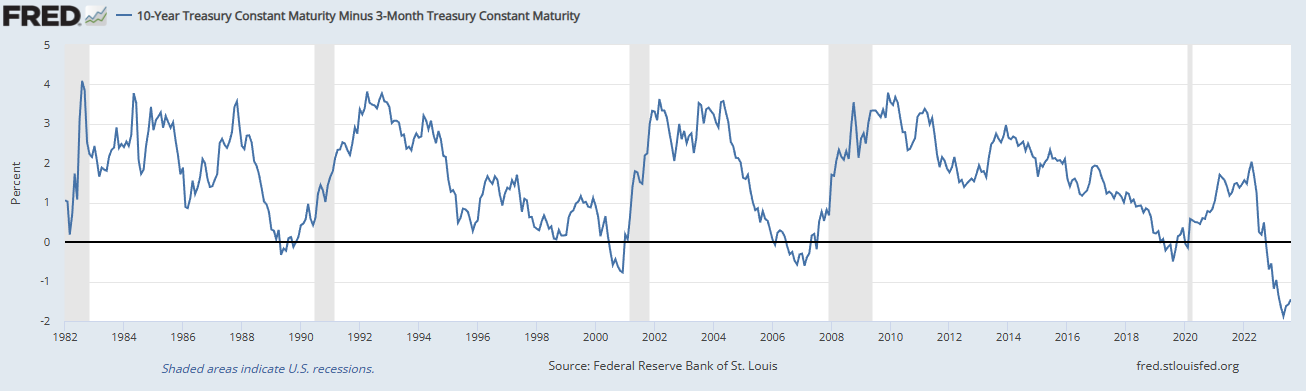
The only period showing a larger inversion that what we saw during the 1970s was in the lead up to the Great Depression in 1928 and 1929.
In response to this, some people might say “if the yield curve is so inverted, where is the mass unemployment and recession?” Well, there is a generally a sizable lag between the yield curve inverting and the onset of recession. For example, the yield curve inverted in 1989, but the 1990 recession did not begin until 13 months later. Similarly, the yield curve inverted in August 2006, but the Great Recession did not begin until December 2007, 16 months later. The yield curve again inverted in May 2019, and it is extremely likely there would have been a recession in late 2020 had the Federal Reserve not engaged in massive amounts of monetary pumping throughout the year to blow a series of bubbles designed to cover up the economic effects of forced lockdowns on the economy.
Now, the yield curve has been inverted since November 2022, but only seven months have passed since then. Experience suggests we could be looking at at least another six months before the effects are clear.
Editor’s Notes:
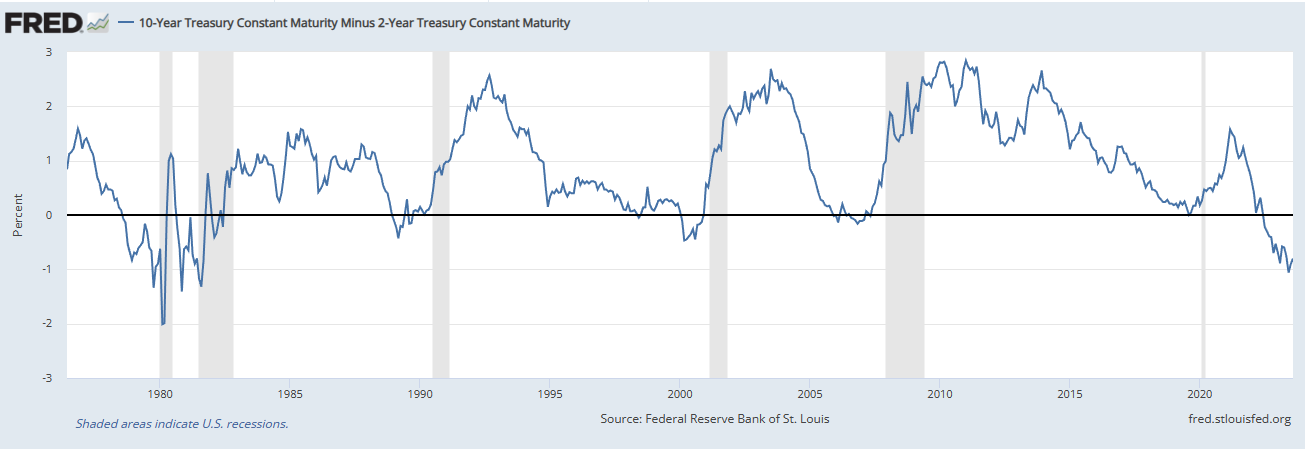
Another way to look at the yield curve is to compare the 10-year treasury rate to the 2-year treasury rate. In this chart we can more easily see the lag between the inversion and recessions.
Not everyone is convinced the flattening curve is telling the true story. They say the Fed’s bond buying program (as part of their quantitative tightening) has resulted in an undervalued U.S. 10-year yield while their raising rates has artificially driven up short-term rates. Others believe that government intervention is WHY the inverted yield curve invariably not only indicated a coming recession but actually causes the recession. In recent months we have seen how the inverted yield curve has affected Bank Balance sheets causing some California banks to fail.
Banks tend to “lend long and borrow short” (i.e., mortgages vs savings accounts) which works fine as long as long as long rates are higher than short rates. But when rates are inverted banks end up paying out higher rates on savings than they are receiving on mortgages. This can’t go on for very long without serious consequences. Initially, banks “tighten the purse strings” by curtailing lending this puts the brakes on the economy and eventually results in a recession. This time may be different however, because so much liquidity is sloshing around in the economy that there is still plenty to go around. Of course, since there is usually a lag before the inversion results in the recession it may be only a matter of time before this one takes effect as well. Only time will tell.
For more info see:
- Central Banks Respond Differently to the Banking Crisis
- The 3 Major Causes of Bank Problems
- How Loose Monetary Policies Cause Recessions
Other articles by Ryan McMaken:
- Do “Red States” Ride the “Blue State” Gravy Train?
- A Guide to Good Money
- Are Countries Getting Smaller?
- Housing Is Getting Less Affordable
- The Fed’s New “Tightening” Plan Is Too Little, Too Late
About the Author:
Ryan McMaken is the author of Breaking Away: The Case for Secession, Radical Decentralization, and Smaller Polities (forthcoming) and Commie Cowboys: The Bourgeoisie and the Nation-State in the Western Genre. He was a housing economist for the State of Colorado. Ryan is a cohost of the Radio Rothbard podcast, has appeared on Fox News and Fox Business, and has been featured in a number of national print publications including Politico, The Hill, Bloomberg, and The Washington Post.
![]() This article originally appeared here and was reprinted under the creative commons license.
This article originally appeared here and was reprinted under the creative commons license.