If you follow the oil news, you’ve probably heard about the OPEC oil deal between Russia and the energy ministers from Saudi Arabia, Qatar, and Venezuela. When the news was announced Oil prices jumped. But if you think this deal actually means anything I’ve got a bridge to sell you.
So before you go buying any bridges or buying any oil future’s contracts, let’s take a look at the facts. First of all, like most deals written by politicians this one is loaded with loopholes. The biggest loophole is “the freeze will only occur if other oil-producing nations also join the agreement.” That’s a big “IF” right there.
The next big loophole is that they agreed to freeze oil production at January levels. Russia has been ramping up production and probably can’t squeeze much more production out if they tried. Russian oil output was 10.58 million barrels per day in 2014 and for all of 2015 output was pushed up to an average of 10.73 million barrels per day. Production averaged 10.83 million barrels per day in December, compared with 10.78 million barrels per day in November. Russia is already at their limit, so agreeing to limit production to current levels is akin to promising prisoners in Siberia all the snow they can eat. So the key factor in this deal isn’t Russia.
World Oil Production
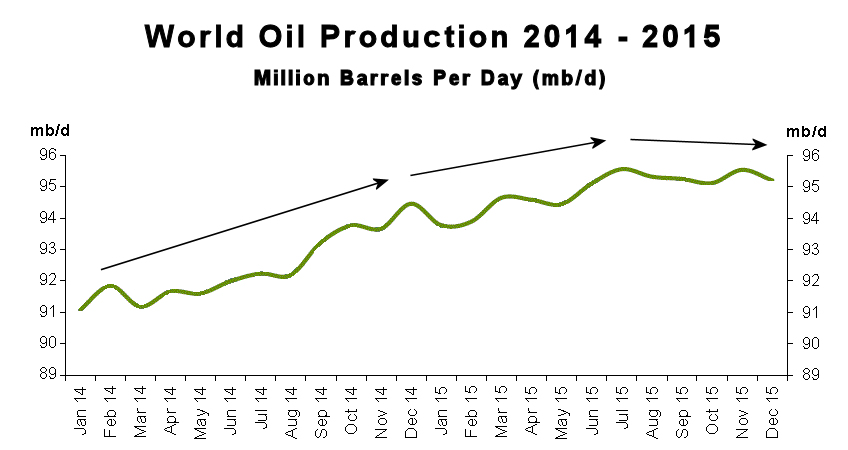 Looking at the above chart we can see that world oil production began 2014 at around 91 million barrels per day (mbd). From there it rapidly ramped up to about 94 mbd by year end. The next six months saw a further increase but the second half of 2015 saw production leveling off between 95 and 96 mbd. The common wisdom is that the vast majority of that increase came from the Saudi’s trying to drive the shale oil producers out of business with cheap oil.
But did it really? We’ve already seen that Russian oil production increased by about 0.25 mbd (250,000 barrels per day) which accounts for a very small portion of the 4+ mbd increase from January 2014 – December 2015. Let’s look at OPEC.
OPEC Oil Production By Country
We all know that OPEC members don’t always report their production accurately. Sometimes they under-report for various reasons, like when they are given a quota by OPEC and they want to sell a bit extra or because some of the oil is being sold on the “Black Market”. At other times they over report if they are trying to establish a level for upcoming quotas. So the following data comes from “independent sources” rather than government sources.
The table below lists OPEC oil production per country in January 2014 and again in December 2015. They are sorted by increase between the two dates.
| Jan-14 | Dec-15 | Difference | |
| Iraq | 2.998 | 4.309 | 1.311 |
| Saudi Arabia | 9.628 | 10.088 | 0.46 |
| Iran, I.R. | 2.733 | 2.882 | 0.149 |
| UAE | 2.756 | 2.895 | 0.139 |
| Angola | 1.633 | 1.751 | 0.118 |
| Ecuador | 0.529 | 0.551 | 0.022 |
| Venezuela | 2.331 | 2.348 | 0.017 |
| Algeria | 1.148 | 1.103 | -0.045 |
| Qatar | 0.738 | 0.674 | -0.064 |
| Kuwait | 2.806 | 2.708 | -0.098 |
| Nigeria | 1.903 | 1.789 | -0.114 |
| Libya | 0.510 | 0.394 | -0.116 |
| ————– | ———- | ———- | ———- |
| Total OPEC | 29.713 | 32.185 | 2.472 |
As we can see the largest increase came from Iraq which was in the process of getting its production back on line after all the war damage. The second largest increase among OPEC countries was indeed Saudi Arabia at roughly 1/2 mbd but some OPEC countries actually reduced production so the net increase for all OPEC countries was less than 2.5 mbd.
Where Did the Production Increase Come From?
We’ve already discovered that global oil production increased over 4 million barrels per day from January 2014 to December 2015. We also found that 460,000 barrels of the increase came from Saudi Arabia while a whopping 1,311,000 came from Iraq with at total increase from OPEC being almost 2.5 million barrels per day. Plus a little less than 250,000 barrels per day of the increase came from Russia. Which accounts for about 2.7 million out of 4+ million. So where did the rest of the increase come from?
As we can see from the chart below, a big chunk of the increase in oil production actually came from the United States.
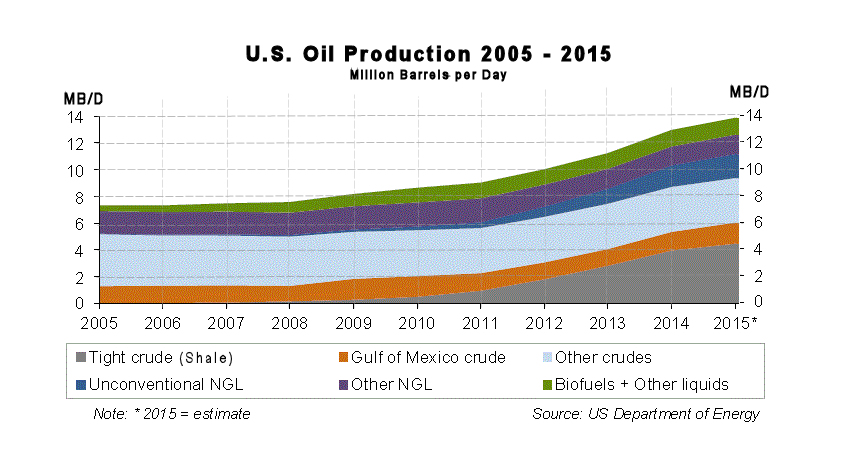
“Biofuels (Green Band) increased significantly from 2005 – 2014 but only added slightly to the production increase from 2014 – 2015. “Tight Crude” (i.e. Shale Oil) accounts for a major portion of the increase in oil production from 2010 through 2014 and also the major portion of the increase from 2014 through 2015. Gulf of Mexico crude increased slightly as did “Unconventional NGL” (Oil Sands and other new extracting techniques).
| United States | 2014 | 2015 |
| Tight Crude (Shale) | 3.955 | 4.47 |
| Gulf Crude | 1.397 | 1.580 |
| Other Crude | 3.358 | 3.320 |
| Unconventional NGL | 1.594 | 1.790 |
| Other NGL | 1.420 | 1.450 |
| Biofuels+Other | 1.238 | 1.260 |
So we can see that U.S. production increased almost as much as Iraq production. The remainder of the production increase is spread around among several countries, for instance 200,000 barrels per day of the increase came from new oil fields coming on line in Brazil, China’s production increased by 80,000 barrels per day, other countries in Asia (i.e Malaysia, Thailand, and Vietnam) contributed 70,000 barrels per day to the increase in 2015.
So ironically shale oil producers might be a victim of their own success (and a rebuilding of Iraqi oilfields).
Production Going Forward
Iraq is already in agreement with limiting oil production at current levels so they could be a major factor in reducing the increase in supply going forward. Of course, in order for the deal to go through the other major players need to fall in line as well.
Iran is the next hurdle in consummating this agreement. Iran intends to drastically increase output in the coming months in order to regain the market share that it lost through years of international sanctions. These sanctions were just lifted in January and so current production is not on par with the other players so OPEC may have to grant Iran special privileges in order to get it on board. So even with an agreement, we might see production increases from Iran.
What about U.S. production?
In most of the other countries oil production is determined by the government… while in the U.S. economics determines production… since the oil is privately owned. With or without an OPEC agreement to cap crude production, U.S. production will probably decline because much of the production increase came because of high oil prices. When oil prices are high exploration goes up and as we saw unconventional oil sources are tapped. But unfortunately unconventional sources don’t last. Shale wells only last about 18 months. So as they dry up new wells are drilled. But with the price of oil low it will not pay to drill new wells, so the U.S. oil supply will shrink. Lower supplies will drive prices up again and the cycle will start all over. Coincidentally, Obama will get the credit for lowering oil prices and our next President (whoever that might be, will be blamed for oil prices rising) even though it is all simply a normal cyclical process and Obama’s policies on coal actually put upward pressure on energy if anything.
You might also like: