In today’s post Gary Tanashian looks at ten charts and indicators to give us a unique look at the trends of the overall economic situation, the state of the “economic recovery” and the employment situation. He looks at where the jobs are, how the average consumer is doing and even the debt to GDP ratio. I think you will find some real gems in his charts. ~ Tim McMahon, editor
By Gary Tanashian
This week’s Notes From the Rabbit Hole included a little Payrolls/Wages related economic discussion before moving on to the usual coverage of stock markets, commodities, precious metals, bonds, currencies and related indicators and market internals. With FOMC on tap there will be more data noise directly ahead, but then I expect markets to smooth out into what is looking like a sensible short and intermediate-term plan.
U.S. Economy
Graphic sources: St. Louis Fed, BLS, TradingEconomics, Macrotrends & Bespoke Premium
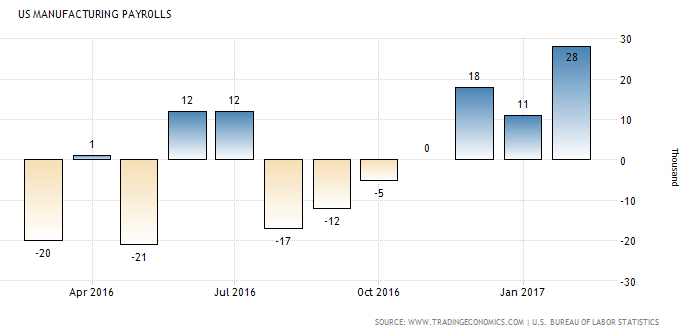
So Payrolls came in a little firmer than expected and interestingly, the manufacturing sectors did some solid hiring. This is an area that is sensitive to coming fiscal policy because it is subject to regulations likely to be repealed (especially environmental, a real fundamental underpinning) and high paying jobs repatriation to U.S. shores (a phony baloney fundamental, at least in large part, in my opinion). In this graph we see that manufacturing job losses had been easing into the election, but job gains have ramped up after the election. All of this on anticipated policy changes?
Manufacturing jobs pay above the average of all industries, but the highest pay rates will go to those programming and maintaining automated systems, including robotics.
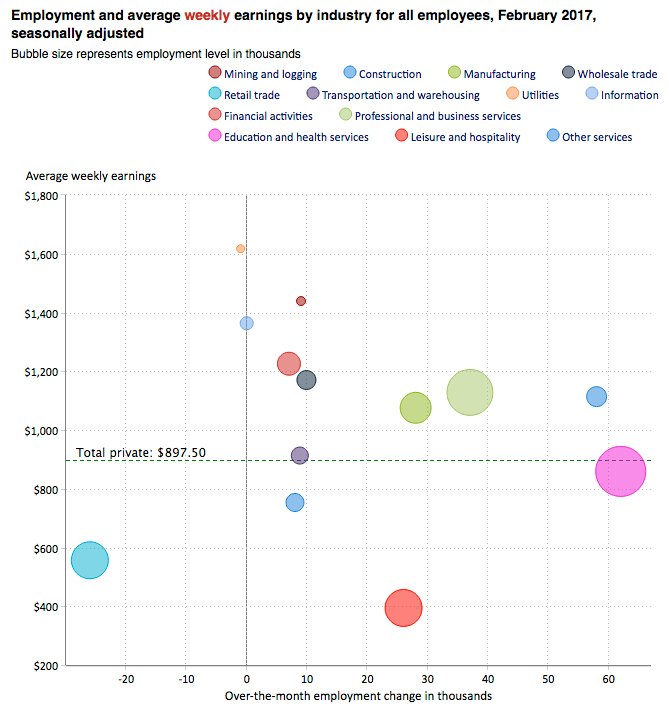
As an aside to the BLS graphic above, look at the red dot languishing down there in the lowest paid quadrant for job gainers. Leisure & Hospitality has consistently been an employment driver as we’ve noted the great consumer economy “servicing itself” month after month as each Payrolls report is released.
Who do you think is filling that ongoing and consistent need for workers to clean hotel rooms, clean restrooms, bus tables and wash dishes? Well, it is not dear old Hazel of yore, that much I can tell you. So who is going to fill those low-wage jobs that the average American may perceive to be beneath them, going forward?

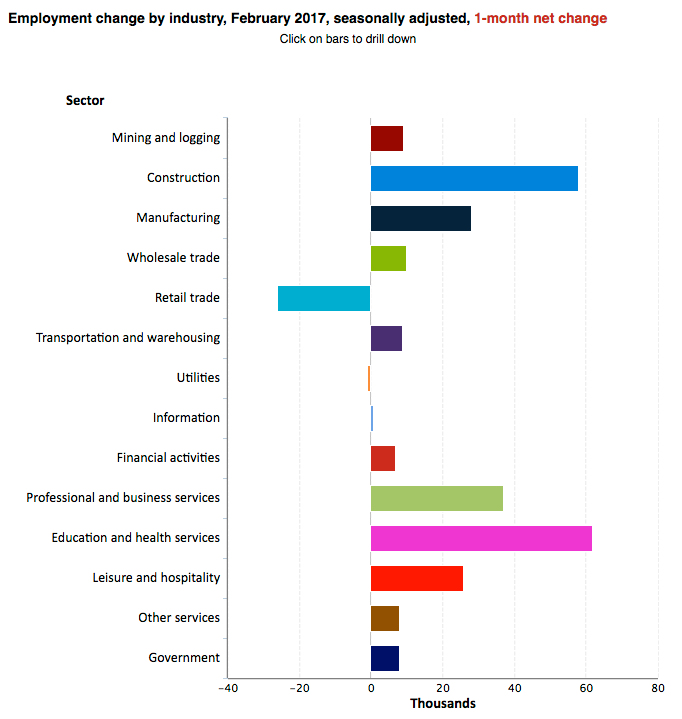
In case you missed it posted at nftrh.com, here is the monthly breakdown by industry.
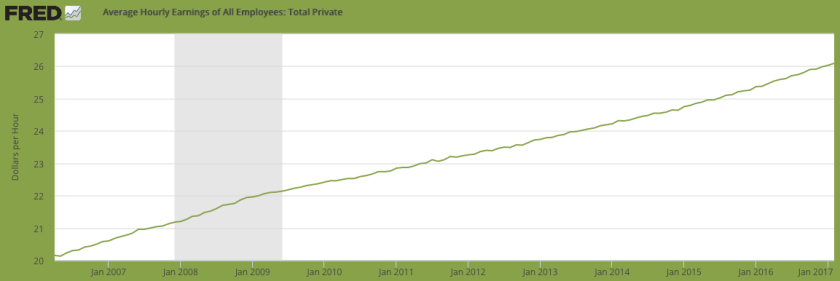
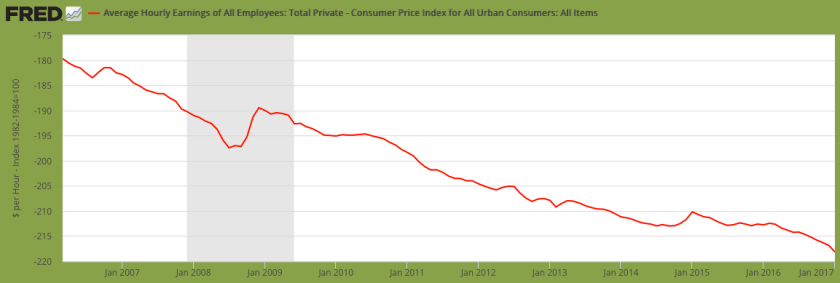
The average hourly earnings of U.S. employees, is at $26.09/hr.
Here is the spread between hourly earnings and the Consumer Price Index. The only time the consumer caught a break was during the crash of ’08.
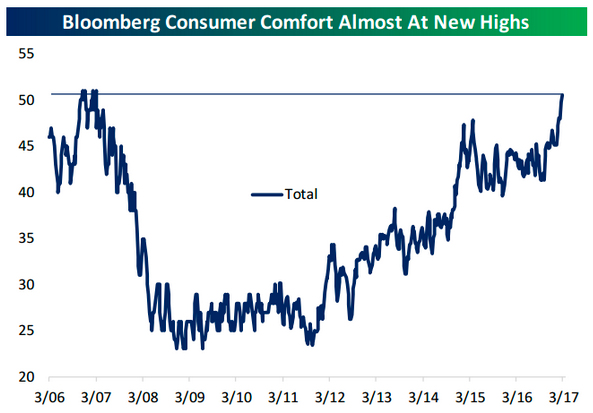
And here is the ‘Consumer Comfort’ index spiking to new highs. We have a forward looking consumer sentiment indicator telling us that things are going to get better, but hard data (wages & CPI) of today telling us that they have not yet gotten better. The consumer is all-in, Donald. He believes you and is depending on you!
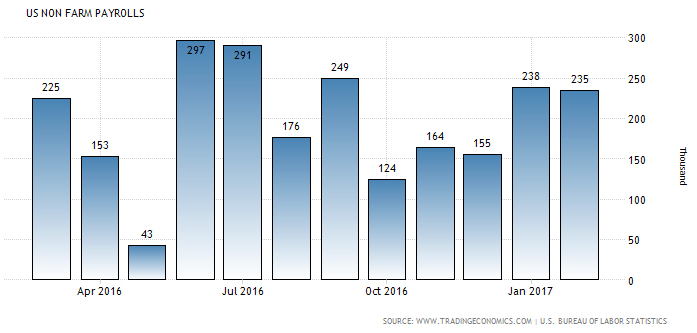
NFP in its firming trend since the election…
But as implied by the sideways shorter-term view above, the long-term trend is just rolling along, as it normally does during an economic “recovery” *.
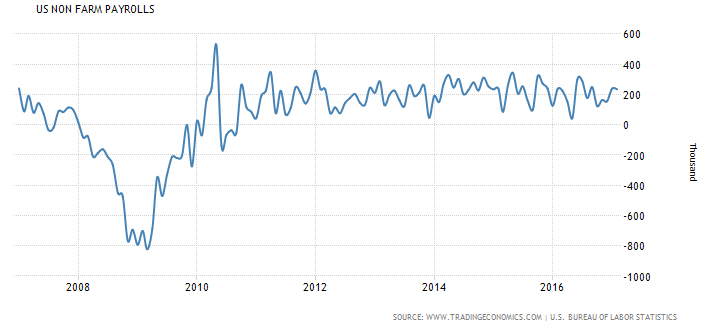
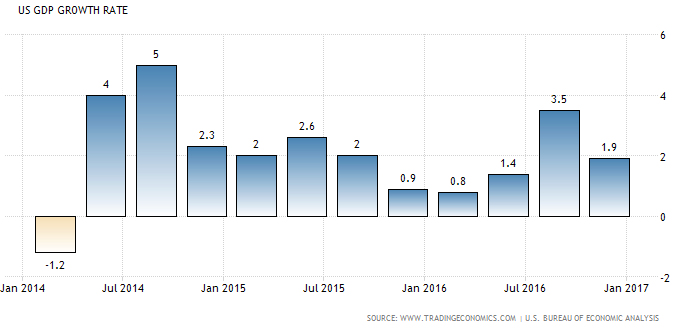
* At some point could we maybe stop calling it a recovery and start calling it a mature economic expansion, to the extent it has already expanded? The mature economy’s 2% growth is the reality that the Trump administration will try to improve upon with ‘fiscal’ stimulation. But the only tools left in the bag may be inflation and debt.
Here is the GDP growth rate…
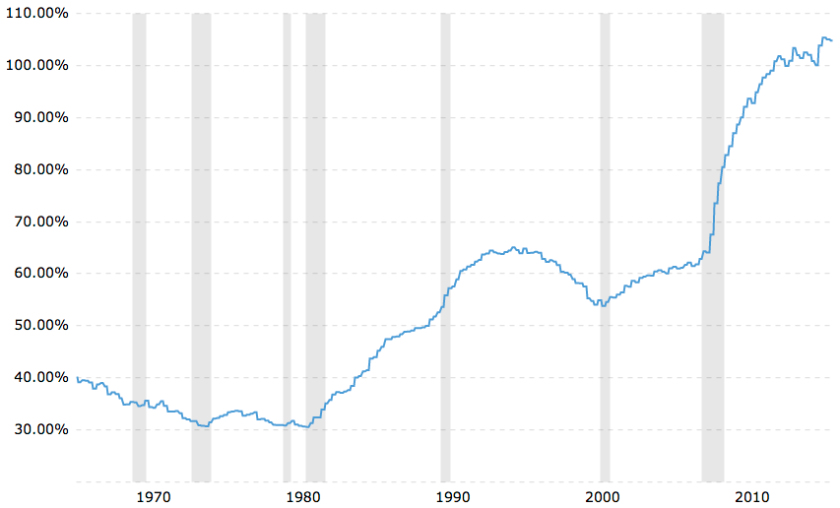
…and here is the long-term debt-to-GDP. Notice that the Reagan-era deficit spend lasted his entire term through Bush 1’s term. Then came a really positive phase in the U.S. economy as deficits came down, stocks bulled and the economy roared. Folks, I’m no fan of Bill Clinton, but the facts are the facts. Many compare the Trump administration to the Reagan administration. If they remain alike, the debt will continue to expand, despite what Trump tweets to the contrary.
At which point NFTRH 438 took off its junior econo-geek hat and proceeded to the main focus, which is as always, the world of asset markets and the tools that provide probabilities related to them. We’ve got some interesting short and intermediate-term plans cooking that could disturb bullish and bearish herds at varying times going forward.
This article by Gary Tanashian originally appeared here and was reprinted by permission.
Subscribe to NFTRH Premium for your 30-45 page weekly report, interim updates and NFTRH+ chart and trade ideas or the free eLetter for an introduction to our work. Or simply keep up to date with plenty of public content at NFTRH.com and Biiwii.com.
Every time you point to the Clinton “success story” in reducing deficits, remember that it was the one-time-only accounting change (gimmick) that ROBBED our security payments to “balance the budget”. Those SS payments have been SPENT, and the payments the SS owes to us are NO LONGER recorded as debt! The true US debt is over $100 TRILLION when SS & medicare liabilities are recognized.
(Retired CPA)
Thanks Dan for reminding us even though I wish we could forget and remain blissfully ignorant.