Which is Over Priced? Oil or Gold?
Updated 12/4/2025
![[Most Recent Quotes from www.kitco.com]](http://www.kitconet.com/charts/metals/gold/t24_au_en_usoz_2.gif) With Gold surging, is it now overpriced? What about Oil? With the value of the dollar constantly changing, it is hard to tell what it all means. After all, can you imagine trying to build a house if every day when the workers arrived, you gave them a different size ruler?
With Gold surging, is it now overpriced? What about Oil? With the value of the dollar constantly changing, it is hard to tell what it all means. After all, can you imagine trying to build a house if every day when the workers arrived, you gave them a different size ruler?
With everything from lumber to bitcoins skyrocketing in price (or the dollar devaluing), is there any way to tell what the real value of something is? How much is anything really worth? Is Gold overpriced? How about Oil? Is it overpriced? Or is it cheap now that the price has come down slightly? Looking at these commodities in the standard way, it is often difficult to tell.
We could look at the inflation-adjusted price of Gold, but that requires that we rely on (and believe) the government-stated inflation index. But that is just one way to look at the price, i.e., by comparing its price to U.S. dollars. We could also look at its price in Euros, or at what the price looks like to the people in China or India. And each of those is based on the values of their fiat currency and how much they are inflating. You might think that if the currency is devaluing, then all prices should rise equally. But in the real world, that isn’t true. There are inequalities partially because money doesn’t flow equally initially. Eventually, it may even out as traders arbitrage high-priced commodities against lower-priced ones or buyers flock to less expensive alternatives. But how do you know which commodities are overpriced and which are underpriced?
Oil Priced in Ounces of Gold:
Very simply, you just divide one price by the other to get a ratio. If we look at the ratio of Gold to Oil, we will see how they relate without bringing dollars into the equation.
Assume for a moment that an ounce of gold is exactly $1000 and a barrel of oil is $100. Let’s look at how many barrels of oil an ounce of gold would buy. Then we are looking at barrels of oil per ounce of Gold. So if Gold is at $1000 /oz and Oil costs $100 per barrel, it is obvious that one ounce of gold would buy 10 barrels of oil, right? 1000/100 = 10.
The mathematics works out like this:
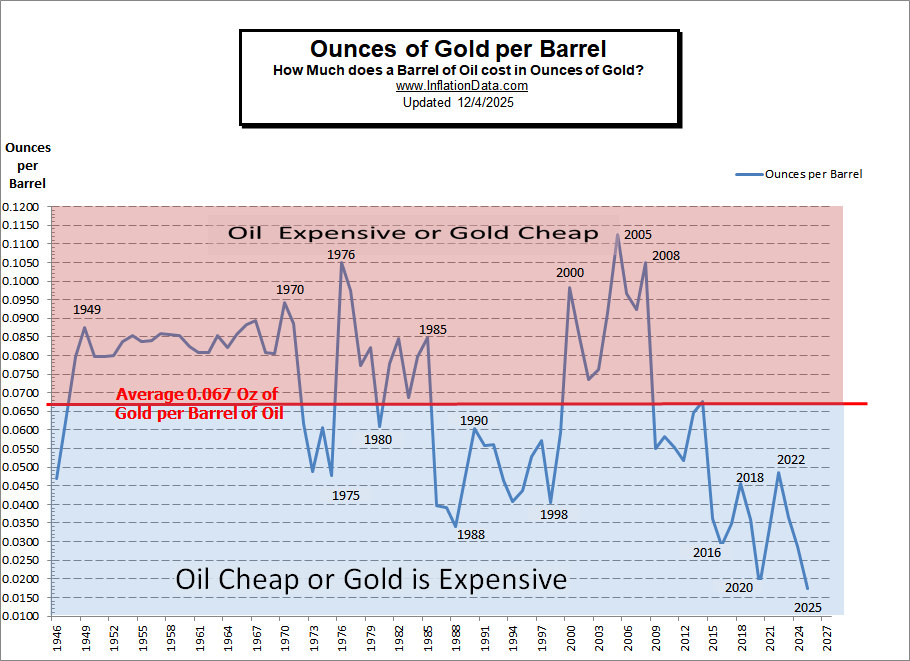
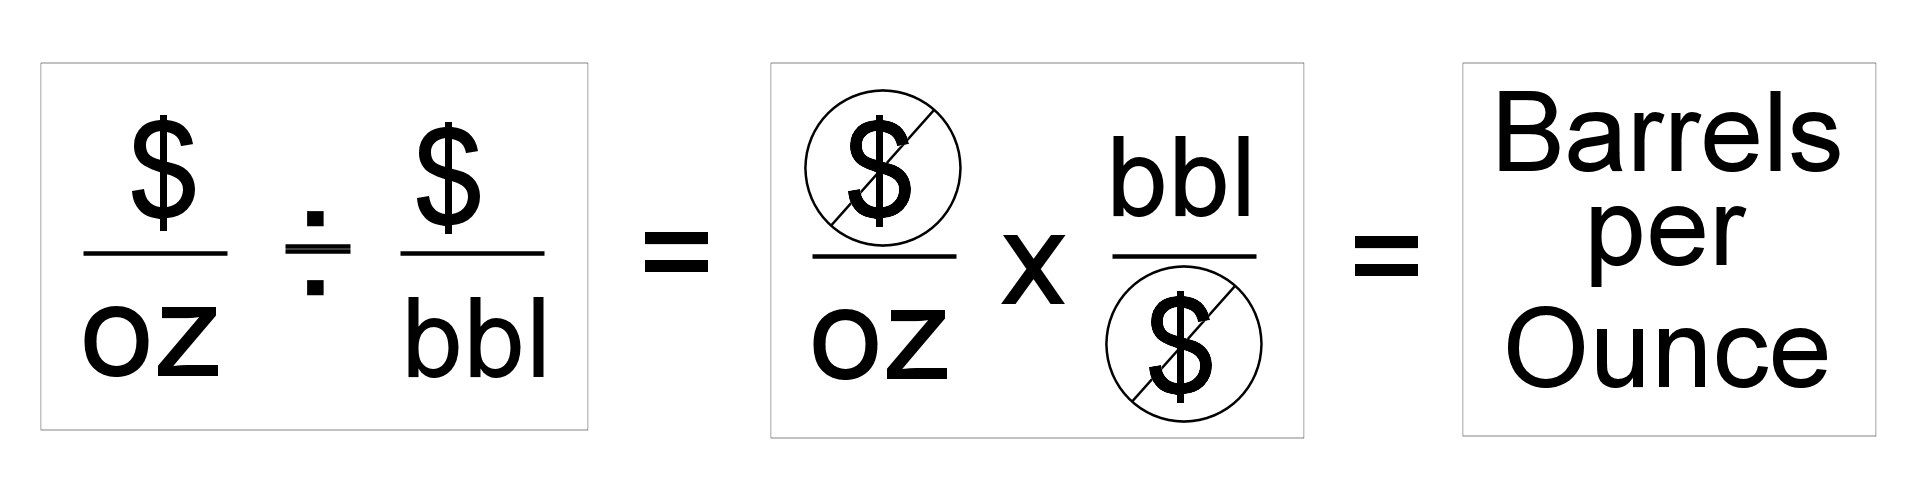 Note: Many economists measure it the other way around, probably because if you consider gold money, normally we would say Dollars per Barrel, so Ounces per Barrel makes more sense. So we will look at both charts. But I prefer barrels per ounce because if you do it the other way around, the numbers come out messier, i.e., it takes a fraction of an ounce of gold to buy a barrel of oil.
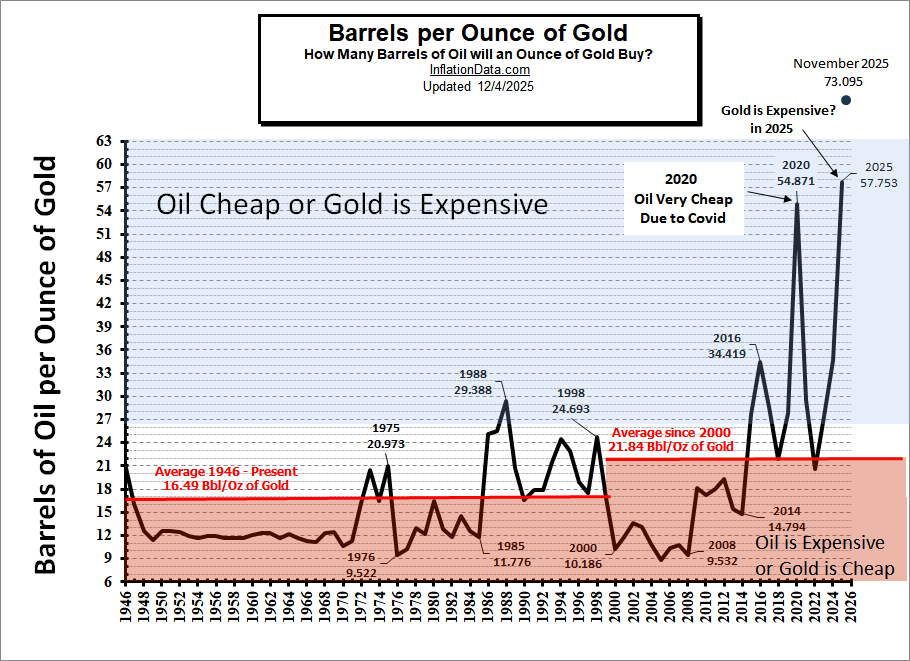
Looking at the chart below, using annual average prices, we can see that in 2025, one ounce of gold bought a lot of oil (the most ever). This happened primarily because the price of gold rose rapidly in 2025 (from $2700 in January to over $4,000 in November) while the price of oil fell from $68.25 in January to $55.93 in November. So, in November 2025, the barrels-per-ounce ratio is off the chart (i.e., over 73 barrels per ounce of gold).
Warning: Just because Gold is currently expensive doesn’t mean it can’t get more expensive if Central Bank Demand continues!
The Ratio is What Matters
If several years ago, gold was at $500 an ounce, and oil was at $50, or if gold is $2000 an ounce and oil is $200 the ratio is still the same (indicating that both oil and gold prices inflated equally).
So, we need to look at the historical ratio and see what a reasonable number of barrels per ounce is.
For prices before Nixon allowed U.S. citizens to own gold again, we used the free market price of gold rather than the government fixed price of $35 / ounce. We also used the free market price of oil (called stripper price) rather than the government fixed price for the period when oil prices were fixed.
- Gold Prices source: Kitco & Exchange-Rates
- Oil Prices source: Plains-All-American & Ioga Oil
From that, we come up with the following table:
| Annual Average Gold and Crude Price 1946-Present |
# of bbl Oil 1 OZ Gold will buy | ||
|---|---|---|---|
| Year | Average $/bbl | Average $/oz | Ave bbl / oz |
| 1946 | $1.63 | $34.71 | 21.294 |
| 1947 | $2.16 | $34.71 | 16.069 |
| 1948 | $2.77 | $34.71 | 12.531 |
| 1949 | $2.77 | $31.69 | 11.440 |
| 1950 | $2.77 | $34.72 | 12.534 |
| 1951 | $2.77 | $34.72 | 12.534 |
| 1952 | $2.77 | $34.60 | 12.491 |
| 1953 | $2.92 | $34.84 | 11.932 |
| 1954 | $2.99 | $35.04 | 11.719 |
| 1955 | $2.93 | $35.03 | 11.956 |
| 1956 | $2.94 | $34.99 | 11.901 |
| 1957 | $3.00 | $34.95 | 11.650 |
| 1958 | $3.01 | $35.10 | 11.661 |
| 1959 | $3.00 | $35.10 | 11.700 |
| 1960 | $2.91 | $35.27 | 12.120 |
| 1961 | $2.85 | $35.25 | 12.368 |
| 1962 | $2.85 | $35.23 | 12.361 |
| 1963 | $3.00 | $35.09 | 11.697 |
| 1964 | $2.88 | $35.10 | 12.188 |
| 1965 | $3.01 | $35.12 | 11.668 |
| 1966 | $3.10 | $35.13 | 11.332 |
| 1967 | $3.12 | $34.95 | 11.202 |
| 1968 | $3.18 | $39.31 | 12.362 |
| 1969 | $3.32 | $41.28 | 12.434 |
| 1970 | $3.39 | $36.02 | 10.625 |
| 1971 | $3.60 | $40.62 | 11.283 |
| 1972 | $3.60 | $58.42 | 16.228 |
| 1973 | $4.75 | $97.39 | 20.503 |
| 1974 | $9.35 | $154.00 | 16.471 |
| 1975 | $7.67 | $160.86 | 20.973 |
| 1976 | $13.10 | $124.74 | 9.522 |
| 1977 | $14.40 | $147.84 | 10.267 |
| 1978 | $14.95 | $193.40 | 12.936 |
| 1979 | $25.10 | $306.00 | 12.191 |
| 1980 | $37.42 | $615.00 | 16.435 |
| 1981 | $35.75 | $460.00 | 12.867 |
| 1982 | $31.83 | $376.00 | 11.813 |
| 1983 | $29.08 | $424.00 | 14.580 |
| 1984 | $28.75 | $361.00 | 12.557 |
| 1985 | $26.92 | $317.00 | 11.776 |
| 1986 | $14.64 | $368.00 | 25.137 |
| 1987 | $17.50 | $447.00 | 25.543 |
| 1988 | $14.87 | $437.00 | 29.388 |
| 1989 | $18.33 | $381.00 | 20.786 |
| 1990 | $23.19 | $383.51 | 16.538 |
| 1991 | $20.19 | $362.11 | 17.935 |
| 1992 | $19.25 | $343.82 | 17.861 |
| 1993 | $16.74 | $359.77 | 21.492 |
| 1994 | $15.66 | $384.00 | 24.521 |
| 1995 | $16.75 | $383.79 | 22.913 |
| 1996 | $20.46 | $387.81 | 18.955 |
| 1997 | $18.97 | $331.02 | 17.450 |
| 1998 | $11.91 | $294.24 | 24.705 |
| 1999 | $16.55 | $278.98 | 16.857 |
| 2000 | $27.40 | $279.11 | 10.186 |
| 2001 | $23.00 | $271.04 | 11.784 |
| 2002 | $22.81 | $309.73 | 13.579 |
| 2003 | $27.69 | $363.38 | 13.123 |
| 2004 | $37.41 | $409.72 | 10.952 |
| 2005 | $50.04 | $444.74 | 8.888 |
| 2006 | $58.30 | $603.46 | 10.351 |
| 2007 | $64.20 | $695.39 | 10.832 |
| 2008 | $91.48 | $871.96 | 9.532 |
| 2009 | $53.48 | $972.35 | 18.180 |
| 2010 | $71.21 | $1,224.53 | 17.196 |
| 2011 | $87.04 | $1,571.52 | 18.055 |
| 2012 | $86.46 | $1,668.98 | 19.303 |
| 2013 | $91.17 | $1,411.23 | 15.479 |
| 2014 | $85.60 | $1,266.40 | 14.794 |
| 2015 | $41.85 | $1,160.06 | 27.719 |
| 2016 | $36.34 | $1,250.74 | 34.419 |
| 2017 | $43.97 | $1,257.12 | 28.591 |
| 2018 | $57.77 | $1,268.49 | 21.958 |
| 2019 | $50.01 | $1,514.75 | 27.846 |
| 2020 | $32.25 | $1,769.64 | 54.871 |
| 2021 | $60.84 | $1,798.61 | 29.563 |
| 2022 | $87.40 | $1,800.09 | 20.596 |
| 2023 | $70.60 | $1,940.54 | 27.488 |
| 2024 | $68.78 | $2,387.43 | 34.710 |
| 2025 Part Year |
$59.45 | $3,433.54 | 57.753 |
| Average | $26.12 | $440.54 | 16.494bbl/oz |
| Average since 2000 | $57.18 | $1,223.91 | 21.836bbl/oz |
| November 2025 (Monthly) | $55.93 | $4,088.22 | 73.095 bbl/oz |
If we look at the ratio of Gold to Oil since 1946, the average turns out to be 16.496 barrels of oil per ounce of gold. Or 1 ounce of gold will buy about 16½ barrels of Oil on average.
If we look at the average ratio during 2020, one ounce of gold would buy 54.87 barrels of oil or more than 3 times normal. This tells us that either Gold was expensive or Oil was cheap (or both). In this case, probably both, due to COVID, there was an Oil glut, so oil was cheap. And since gold is a crisis hedge, due to extreme fear, gold was in greater-than-normal demand. Then in 2025, Gold prices skyrocketed due primarily to Foreign Central Bank purchases. At the same time, Oil prices fell.
So Gold is near all-time highs not only in inflation-adjusted terms but also in terms of oil.
Back in 2005 (before the big crash), greed was in fashion, and no one was fearful; oil was expensive and/or gold cheap. So you would only get 8.88 barrels of oil for an ounce of gold.
But this is where arbitrage comes in… what we can do when oil is cheap is buy oil and sell gold, hoping the ratio would move toward normal. That way, if oil rises in price and gold stays the same, you make money. If gold falls in price and oil stays the same, you make money. Even if both rise in price because of inflation, but oil rises more, so the ratio normalizes, you make money, or if both fall in price but oil falls less, etc.
Quiz # 1
If you could go back to 1985 and be given a choice to invest in Oil or Gold, which would you choose? The ratio is 11.776 bbl/oz. Assuming you have $1268 you could have bought 4 ounces of gold in 1985 at $317.00/ oz or you could have bought 47.10 barrels of oil.
If you bought Gold, three years later, in 1988, you could have exchanged your 4 oz of gold for $1748 and bought 117.55 Barrels of oil. So although your dollars increased by 37.8% your number of barrels of oil increased by 149.6%. Had you held your oil until 2000, when the ratio was back down to 10, your 117.55 barrels would now be worth $3220.87, while four ounces of gold would only be worth $1116.44 or about $150 less than you had paid for it!
In 1988, oil was extremely cheap at over 29 barrels per ounce. But if you had bought oil in 1986 at 25 (also very cheap) it would have appeared that you were losing money for two years until the ratio turned around.
Quiz # 2
In 1998, Gold was $294.24 an ounce, and Oil was $11.91 a barrel. If you had $1200 to spend… Which do you buy?
Based on this chart, at 24 barrels to an ounce of gold, Oil was cheaper. You could have bought 100 barrels for $11.91 x 100 = $1191 and sold them when oil was expensive in 2008 (once again, less than 10 barrels per ounce. At that point, you could have exchanged your 100 barrels for $9148 and bought 10.49 ounces of gold.
On the other hand, had you bought gold in 1998 you could have used your $1191 and bought only 4.047 ounces.
If you are an economist, I’ll include the chart based in standard terms as well.
Gold vs. Oil Chart
Warning: Don’t just go out and start buying oil and selling gold based on this chart. We are using Annual averages for easy comparison. These ratios change on a daily basis. So you need much more up-to-date information than what an annual chart will tell you.
For more information: