By Tim McMahon, editor
I read quite a few books on investing strategy every year but one that sticks in my mind is by legendary investor and trader Larry Williams called The Right Stock at the Right Time. In it he outlines the monthly and yearly trends that can provide a basis for your overall investment strategy.
The monthly trend is basically the the average of all the January gains (or losses) then all the February, then March, etc. It is amazing to see how similar each month is from year to year. Of course not every January is the same as all other Januarys but understanding which are the typically weak months and which are the strong ones can help shape your buying and selling timing.
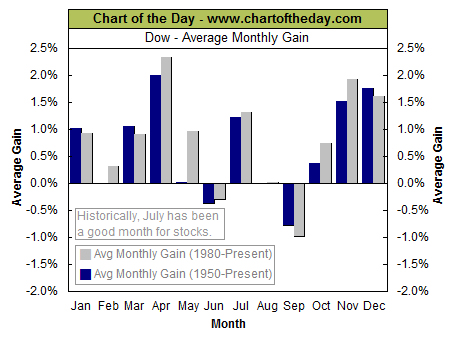
So today when I opened my email I was surprised to find a very similar chart from the good people at Chart of the Day.
You can see that there really is a correlation because if the monthly performance was truly random the highs would cancel out the lows and all of the months would be roughly the same. The average annual rate of return from January 1950 through December 2010 was 12.7% and from 1980 to 2010 it was 12.93%, so you would expect the average month to be around 1% if all months were equal. But instead we see a wide variation from month to month with some months averaging 2%+ (in a month) and other months averaging a 1% loss. That is a wide variation.
Here is what Chart of the Day had to say:
Today’s chart illustrates the Dow’s average performance for each calendar month since 1950 (blue columns and 1980 (gray columns). There are a few takeaways from today’s chart. For one, whether measuring from 1950 or 1980 — the average monthly gains are rather similar. Also, the average year can be divided into both a strong half (November through April) and weak half (May through October). Each one of these semi-annual biases has one calendar month which bucks the trend (February and July). So while the market is currently in the midst of its subpar half of the year, the one calendar month (July) which has tended to buck this trend has arrived.
In addition to monthly trends Larry Williams also covers annual trends in his excellent book The Right Stock at the Right Time. This book received an average of 4 stars by readers at Amazon and I agree.
Here is what a couple of reviewers said,
“Williams also covers the best years of each decade to invest – fifth, eighth and ninth years. The consistency of these three years performance is 80% (positive returns in 8 out of 10 of those decade years.”
“I have over 300 books in my Investment Library,and this is one of the few I set aside as a reference.”

