If you’ve been around here for a while, you will know that the typical correction erases between 20-30% of a market’s value, and once in a lifetime, it will wipe out over 50%. Surprisingly the first decade of the new millennium had two such massive corrections, each lasting for over four years.
In the following chart from Statista, we can see the length and depth of the major recent corrections on the S&P 500.
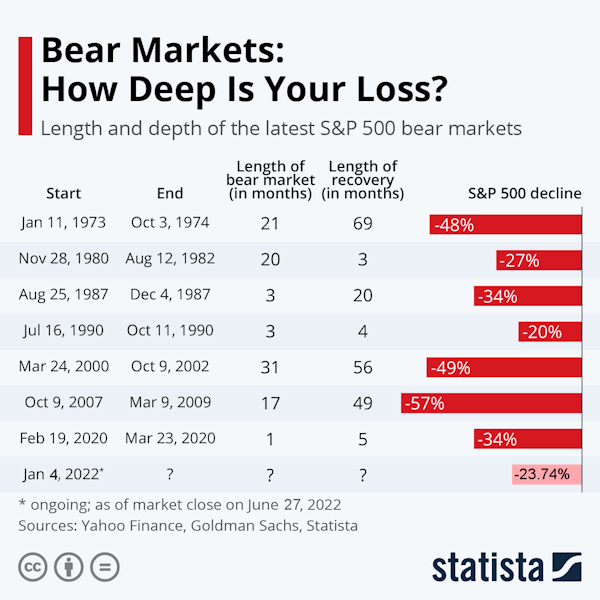
So far in 2022, the S&P 500 peaked at 4,818.62 on January 4th, and reached a low of 3,674.84 on June 17th. That is a -1,143.78 point loss or -23.74% in 5 months. If that is the end, it will be considered a “mild correction”. Only three of the seven previous corrections lasted five months or less, while the other four lasted MUCH longer. As we can see from the chart, on a statistical basis, the correction could have quite a bit more to go. At this point, the market has rebounded a bit, wiping out a bit of that loss. In the previous seven bear markets, the S&P 500 dropped an average of 38 percent before rebounding, and it often took years before the index returned to its last peak.
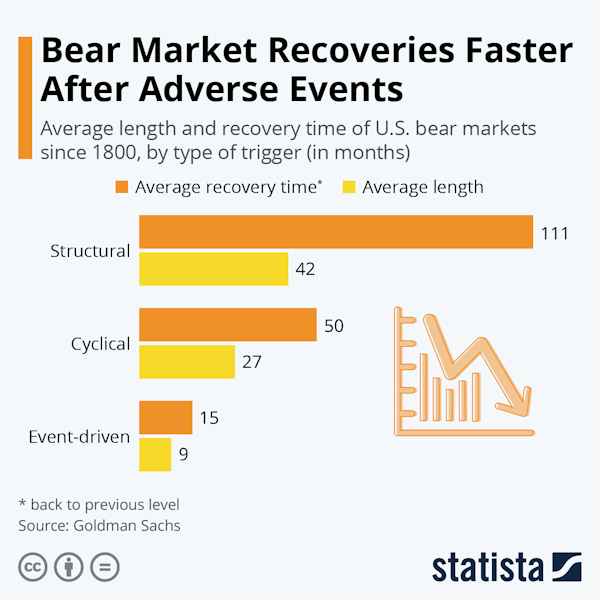
In looking at previous corrections, we can almost dismiss the 2020 correction since it was artificially created by the COVID scare and wouldn’t have happened on its own. It was halted in its tracks by the massive FED intervention, which sowed the seeds of our current inflation and resulted in the shortest recession in history. Typically, bear markets that are triggered by adverse events (such as COVID) end sooner and decline less than those resulting from more systemic or cyclical causes.
Statista looked at the average length and recovery time of corrections since 1800. Structural reversals took the longest to recover from. This makes sense since correcting the underlying structural problems would take time.
So, the question arises, are we in a structural, cyclical, or event-driven correction? There isn’t much evidence that it was event-driven since the correction began before Putin invaded Ukraine, so that only leaves structural or cyclical, or perhaps a combination of both.
Cyclical Factors
A quick glance at the following chart shows low occurs approximately every three years.
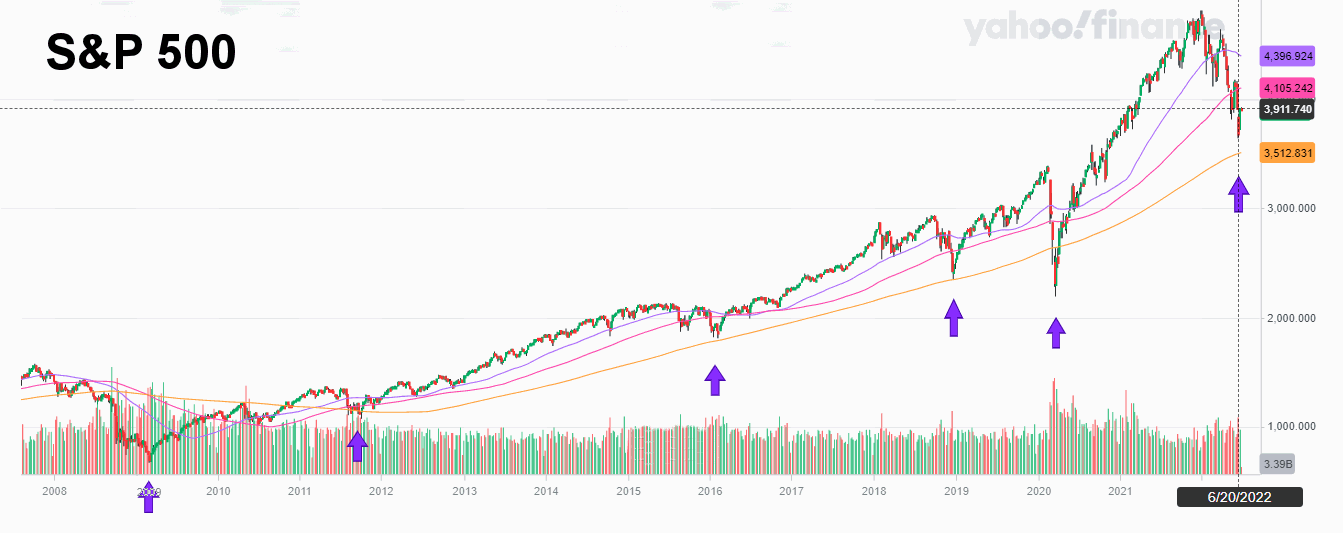
An argument can be made that the first low was in 2009, and the second low arrived a bit early in 2011 rather than 2012. Then the next low waits until 2016 rather than coming in 2015. Three years later, we get a low in 2019. And if we ignore the 2020 low as being caused externally rather than cyclically, the next low would be due roughly three years from 2019, i.e., in 2022.
Structural Factors
But there are also many other factors at play; the FED tightening is a major factor in putting a damper on the market. Liquidity is being cut, interest rates are rising, and there are still supply chain ramifications of the COVID shutdown.
Historically, looking at corrections since 1800, event-driven bear markets showed smaller declines, with an average 29 percent loss (remember COVID resulted in a 34% correction). Cyclical bear markets averaged a 31 percent decline, and structurally caused corrections resulted in a 57 percent loss.
So if we are in an event-driven correction, we can still expect another 4% loss, but if this is a cyclical bear market, there would be a couple of percentage points more beyond that to lose. Unfortunately, if this is a structurally caused correction (and it very well might be), we are only halfway to the bottom.
You might also like: