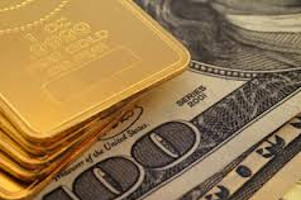
Fear vs Greed

Reasons To Remain Open To Bullish Outcomes For Stocks

Any data that tells us to keep an open mind about better than expected outcomes must be confirmed by the stock market; something that has not happened yet. For example, if the stock market is to rally for the next few months in a surprising manner, that is not possible as long as the S&P 500 fails to make a higher high above 2,134. Our market model does not make decisions based on what “may or may not happen”. Therefore, the only real value to the table and video above is to help us remain open to and prepared for all outcomes (bullish and bearish). A few reasonable S&P 500 guideposts relative to improving bullish probabilities include 2096, 2107, 2116, and 2134. Each push above a guidepost level improves the odds for the bullish case. Below these levels, the expression “the market has some work to do” applies.

Reasons To Remain Open To Bullish Outcomes For Stocks Read More »

More “Funny” Data from the Government

In the past, I documented the overstatements by both the IEA and EIA in 2014 & 2015 in terms of supply, inventory and understatements of demand. Others also noticed these distortions and, whether intentional or not, they exist and they are very large in dollar terms. These distortions, which are affecting price through media hype and/or direct/indirect price manipulation, are quite possibly the largest in financial history.

Putting numbers behind it, with worldwide production running some 95 million barrels per day, and assuming $55 per barrel for oil, the market for crude oil is about $5.2 billion per day. Each $10/Barrel change is worth nearly $1 billion/day or $365 Billion/year for the worldwide crude oil market. Add the worldwide equity market caps of oil and oil related equities and debt you have a scandal that is in the trillions; a number that cannot be ignored.

According to Cornerstone Analytics, who have documented the IEA systematically underestimating demand in 2012-2013 only to revise it higher quarters if not years later, the EIA has created the appearance of an imbalance of supply by some 500 million barrels or $2.5 trillion in the last 5 quarters alone. This has easily swung oil by at least $20/barrel if not more.

More “Funny” Data from the Government Read More »

Greece Should “Shoot the Dog and Sell the Farm”

The bell is tolling for Alexis [Tsipras]. European leaders from all sides have abandoned him as he burns through every last bridge that was once in place. His only meeting of importance during this crucial week of negotiation is with Putin – which clearly does not inspire any confidence for a near-term resolution.

It is actually amazing that we have not seen any of the left-leaning party leaders from the rest of Europe running to Tsipras’ side as he truculently engages his paymasters. Where are all these European anti-austarians? Of course they are hiding from the Germans, hoping not to receive the same fate as Alexis. So there he sits, alone and under his last Soviet-held bridge, just like Hemingway’s Robert Jordan. He is waiting to cause just a little more damage before his time is up.

In the end, there is no question that the Germans have executed a near flawless plan to humiliate and vilify Greece. The Greeks now stand as poster children for European profligacy. And they are being paraded through every town square in the EU, in shackles, as the bell tolls near the gallows for their leader.

Greece Should “Shoot the Dog and Sell the Farm” Read More »

Financial Warfare

The Evolution of Economic Warfare and the Oil Weapon

To understand why financial warfare and the oil weapon is so common, you must understand how it came into existence and what it has achieved. The oil weapon first came into existence in 1965, when Egypt nationalized the Suez Canal. What resulted from this was a declaration of war by France, England, and Israel. As a way to counter this invasion, Saudi Arabia decided to ban exports to England and France. Although this embargo turned out to have minimal economic impact, it was a beginning.

The Evolution of Economic Warfare and the Oil Weapon Read More »

Just When You Thought Bonds Were Safe

In today’s article Jared Dillian compares the 2/10 yield curve to a “Double Black Diamond” ski slope. In other words, it’s wickedly steep! The yield curve he is talking about here is the 10 year treasury yield minus the 2 year treasury yield. This spread measures the steepness of the yield curve. When it is high there is a big difference between the 10 year treasury yield and the 2 year. When it is small investors are not receiving much benefit for taking on longer term risk. Normally the yield curve is positive and longer-term rates are significantly higher than shorter-term rates. In abnormal cases the yield curve becomes “inverted” and short-term rates are actually higher than long-term rates. As Jared tells us, if even a small amount of inflation returns it will create havoc in the long term bond market.

Just When You Thought Bonds Were Safe Read More »

Scroll to Top