Economic Basis For Large Bear Market Declines
By Chris Ciovacco
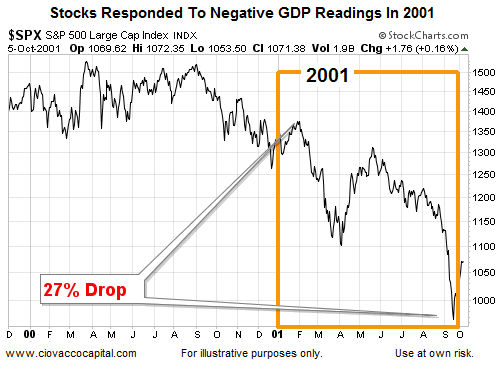
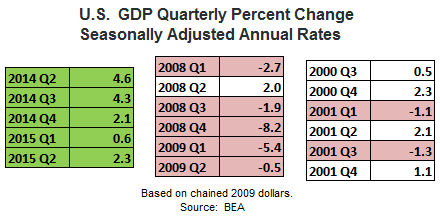
As we noted in a recent “recession odds” article, bear markets typically are caused by one of two things: a recession or tight monetary conditions. For example, the 2000-2002 bear market featured a rough economic period in 2001 (see table below).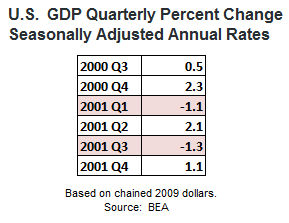 The chart below shows a period in 2001 that featured a 27% drop in the S&P 500, which even in isolation crossed the widely accepted 20% threshold defining a bear market. The big drop occurred during the period of weak economic growth as shown in the table above.
2001 vs. 2008 vs. 2015: Another Perspective
This week’s video makes additional fact-based comparisons of the present day to both 2001 and 2008, allowing us to better understand correction odds relative to bear market odds.


How About 2008-2009 And Economic Growth?
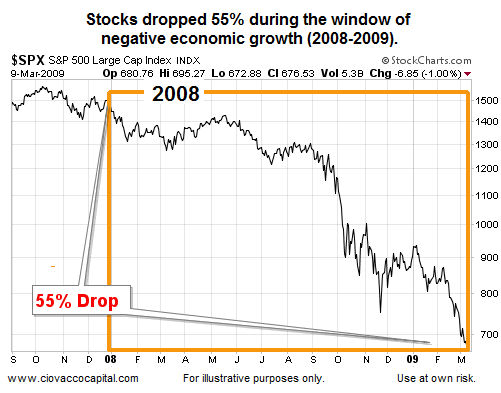
Stocks did not drop like a lead balloon for no reason during the financial crisis. The economy experienced a significant contraction (see table below).
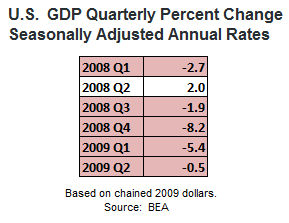
The vast majority of the losses in stocks during the financial crisis occurred during the window marked by negative GDP.
How Does The Same GDP Table Look In 2015?
Respecting that economic forecasting is difficult at best and negative growth could be around the corner, the facts we have in hand look quite a bit better than those during the “plunge periods in stocks” shown above (2001, 2008-2009).
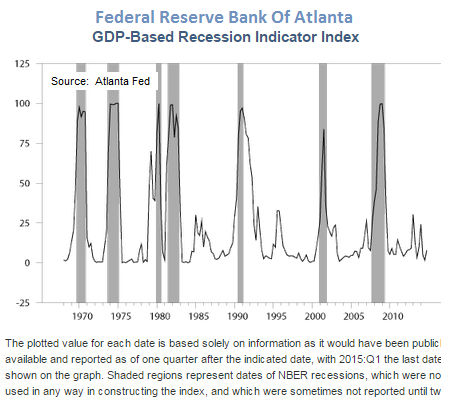
Odds Of A Recession: August 10, 2015
The Federal Reserve Bank Of Atlanta has done a good job with the difficult task of forecasting economic growth recently. While the Atlanta Fed is forecasting a tepid GDP figure of 0.7% growth in Q3, their GDP-Based Recession Indicator Index is not screaming “run for the stock market and economic exits”. From the Atlanta Fed based on data as of August 10, 2015:
The GDP-based recession indicator index rose a little with the latest GDP figures, and currently stands at 13.3 percent. There has been a modest but temporary jump up in the index during the first quarter of each of the last three years, reflecting in part the weak winter GDP numbers. Even so, a value of 13.3 percent is not particularly high by historical standards. A paper by Marcelle Chauvet and James Hamilton (from Nonlinear Time Series Analysis of Business Cycles, 2006, edited by Costas Milas, Philip Rothman, and Dick van Dijk) concluded that the U.S. could be said to have entered a recession when the index rises above 67 percent.

How Can This Analysis Help Us?
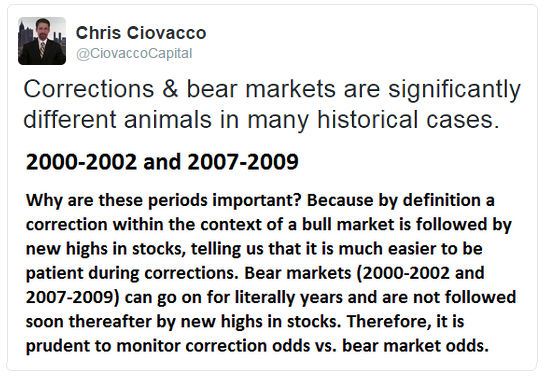
The GDP figures we have in hand and the charts in the video tell us the current odds favor the next bout of weakness being a correction within a bull market rather than the start of a multiple-year decline in stocks. The tweet below outlines why the previous statement is helpful.

Investment Implications – Flexibility Required
Our purpose here is not to paint an “everything is fine” picture. The observable evidence tracked by the CCM Market Model has deteriorated in a significant manner, calling for a reduction in our model equity exposure. The GDP data and technical evidence in this week’s video, along with recent sentiment data, help us with the “stocks could still surprise on the upside” scenario, allowing us to remain open to an improvement in the hard evidence. Until the hard data begins to improve, a healthy dose of skepticism and respect for risk management remain in order. It also remains prudent to have migration plans for both bullish and bearish outcomes.
This article originally appeared here and has been reprinted by permission.
This article is distributed for informational purposes only and should not be considered as investment advice or a recommendation of any particular security, strategy or investment product. The charts and comments are not recommendations to buy or sell any security.