Economic Trends

Long-term trends grow from short term trends. We attampt to determine the short term trends and where they are pointing.

Natural Monopoly

There is No Such Thing as a “Natural” Monopoly

The for many years telephone services and electricity were considered “natural monopolies” and competition was prohibited by the government or you could say the dominant player was protected by the government. But then in January of 1982, the government reversed its longstanding protection of Bell Industries and broke it up into a bunch of “Baby Bells” that could compete against each other. And along came cell phones and the rest is history.

There is No Such Thing as a “Natural” Monopoly Read More »

NYSE Weekly 4-26-23

Big Move Coming in Stocks

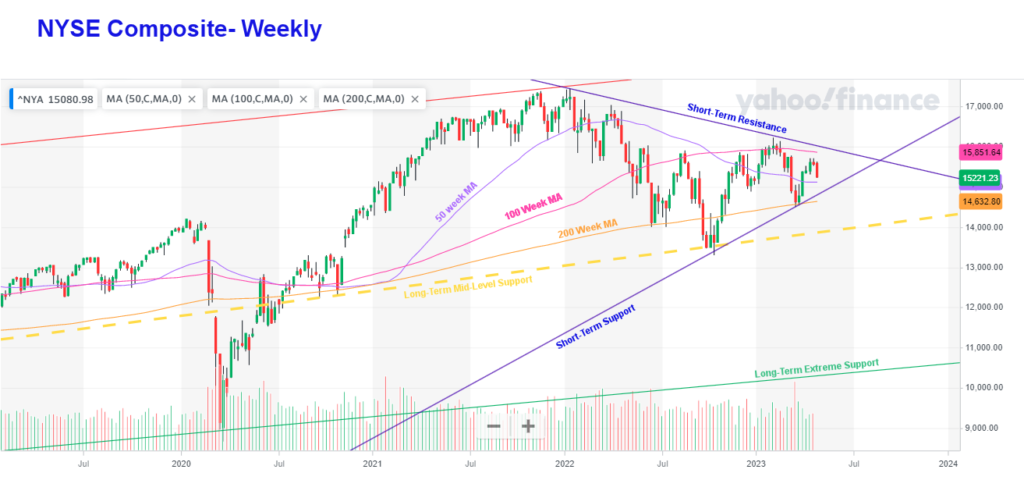
The stock market appears to be approaching an “inflection point.” Mr. Market is going to have to make up his mind… whether this is going to turn into a bullish or bearish market. At this point, it could still go either way, but the big caveat is that when it moves, the move will probably be dramatic. Looking at the following chart, we can see the two blue short-term support and resistance lines are forming a “pennant” formation. Generally, when that happens, it is like a spring being coiled up as the index gets compressed into the two lines. When it finally breaks free in one direction or the other, it is often explosive.

Big Move Coming in Stocks Read More »

Inverted Yield Curve March 2023

Stock Market Outlook – March 24, 2023

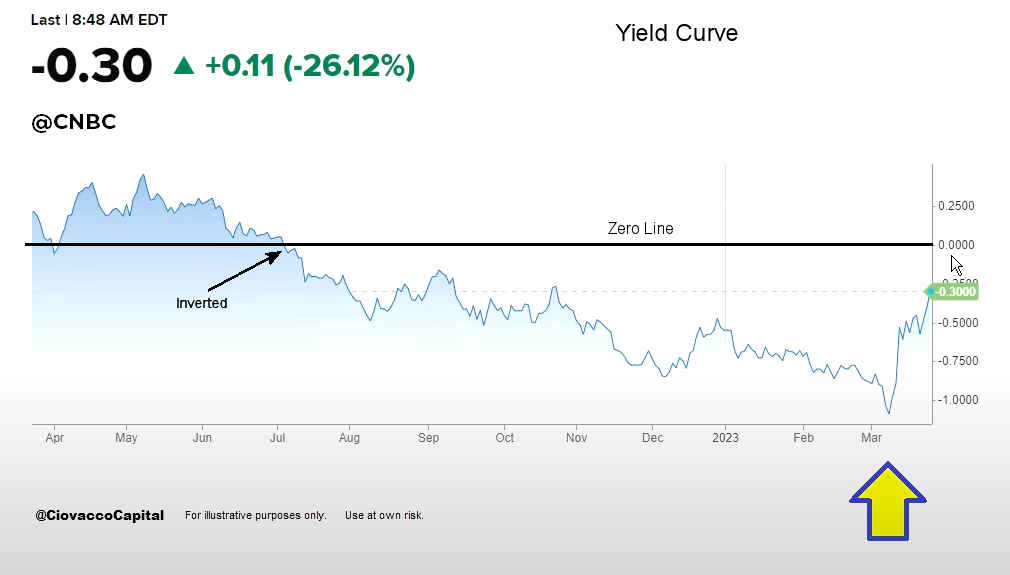
Today Chris Ciovacco of Ciovacco Capital Management looks at the market situation in light of the bank failures. First up is the Inverted Yield Curve. We can see that it originally inverted in July of last year, when short-term interest rates moved higher than long-term rates. From there it moved steadily lower before rebounding earlier this month. So although it is still inverted it is not anywhere near as bad as it was just a few weeks ago.

Stock Market Outlook – March 24, 2023 Read More »

Dollar Dominance

More Cracks in U.S. Dollar Dominance

Back in 1933, Roosevelt forced Americans to sell their gold to the government for $20.67 an ounce and then promptly raised the price to $35/oz. Thus he presided over a 69.33% gain in the value of gold which was equivalent to a 69% tax on the ownership of gold. Then at the tail end of WWII, Roosevelt pulled off the Bretton Woods agreement that made the U.S. the dominant world currency. When that began to fail Nixon cut a deal with Saudi Arabia instituting the “Petrodollar” which once again put the dollar at the top of the heap. But now some cracks are once again emerging.

More Cracks in U.S. Dollar Dominance Read More »

NYSE Daily 1-23-2023

Has the Stock Market Turned Positive?

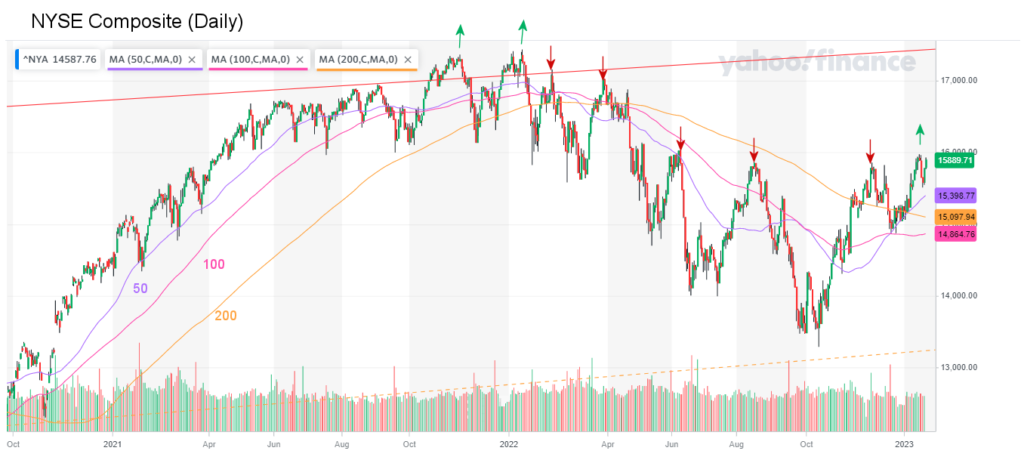
It has been a long time since there has been any positive news for the stock market. In our January 12th, 2023, NYSE ROC report, we changed from a “Sell Signal” to a “Hold Signal” because of some positive indications in the market. Although the ROC has not yet switched to a “Buy”, we noticed a few positive indicators that could indicate either a bottom has been set or that we are in for a short-term rally. Some may call this “green shoots” in the market.

Has the Stock Market Turned Positive? Read More »

dollar-hegemony

Is the U.S. Dollar Hegemony Ending?

The U.S. has been the currency of foreign exchange ever since the Bretton Woods agreement of 1944. It did experience a crisis of confidence in the 1970s, but the Nixon / Kissinger deal with Saudi Arabia to create the PetroDollar whereby all oil sales had to be completed in U.S. Dollars (in exchange for military support) recemented the dollar’s prominence for another half-century. But now things are changing. In today’s article, Patrick Barron looks at the current state of Dollar hegemony.

Is the U.S. Dollar Hegemony Ending? Read More »

M3 Components

Latest Recession Alarm

There’s a new Recession Alarm! Money Supply Growth can have a significant influence on the state of the economy. When the FED is pumping, and the money supply is growing, Woo Hoo, it’s happy days, but when the flow dries up, the economy goes into a tailspin. As we have repeatedly implied, via the FED’s massive Quantitative Easing, the money supply has grown exponentially over the last decade.

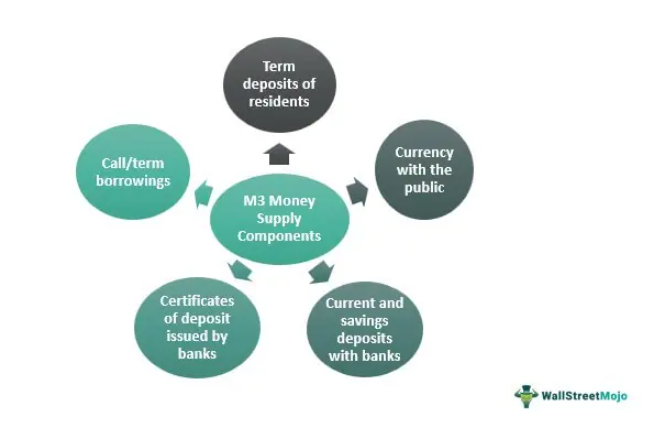
But today, let’s look at the M3 money supply itself. The M3 money supply is a broad measure of money, including M2 plus much more. It is an indirectly derived measure of the supply of money which includes currency in circulation, checking and savings deposits, certificates of deposit, term deposits, call/term borrowings from ‘non-depository’ corporations by the banking system, and ‘Other’ deposits with the central bank.

Latest Recession Alarm Read More »

NYSE Composite Chart

Half-Way to the Stock Market’s Worst Case Scenario

On the NYSE weekly chart. we can see that this year so far, the index has fallen from the peak at the long-term resistance line down to the mid-line (as we said it would). So as the headline suggests, we are now halfway to the worst-case scenario, i.e., all the way down to the long-term support line. Whether it gets that bad or not remains to be seen.

Half-Way to the Stock Market’s Worst Case Scenario Read More »

Scroll to Top