Timing the Crypto Market
 Using our ROC (Rate of Change) system to look at the two biggest cryptocurrencies, i.e., Bitcoin and Ethereum, gives us a unique insight into these cryptocurrencies. Our charts are now using the weekly prices so we can get a bit more precise timing.
So, let’s look at Bitcoin first. Bitcoin is EXTREMELY volatile, but many believe that this is a “feature” and not a “bug”, as they play the volatility for greater gains. Also, because Bitcoin has increased so rapidly since its inception, it is typically plotted on a “Logarithmic” scale. That means that the distance between every horizontal line is 10x bigger than the previous one. If we didn’t do this, the early line would look flat in the beginning, and the last part of the chart would shoot straight up. By using the logarithmic scale, we can see much more detail in the early chart.
We averaged the ROC index to smooth out the bumps so it wouldn’t cross its red moving average lines 100 times. What we came up with was distinct crossings and a nice cyclical pattern. BTC is known for its cyclical nature due to the intrinsic code that created it. Up until recently, it was to a great extent, outside the influence of government manipulations, and the mainstream financial markets, this resulted in a much cleaner pattern and more opportunity for the “little guy”. Historically, Bitcoin has had a 4-year cycle, with three years up and one year down. Despite Bitcoin’s massive drops, had you bought at any point during BTC’s history (even intermediate peaks) and held for 4 years, you would have made a profit.
BTC Price Movements
In early March 2024, Bitcoin peaked at $73,794, well above the previous peak of an even $69,000 in 2021. This peak established a new resistance level that held for over 9 months. During that time, Bitcoin tested that level several times while it consolidated. And then, in typical BTC style, it blasted through and went on to make a new high at $109,356. Then it drifted sideways for a while before retesting its $74,000 support level in April of 2025. That support held, and BTC rebounded to around $95,000 again, where it held for several weeks before making a new high at $112,000 on May 22nd, 2025. Our BTC ROC Chart issued a sell signal on August 16, 2025, with BTC at $115,957. BTC peaked a few weeks later in October 2025 at $126,110. On November 4, 2025, it fell below $99,000, and by December 1, 2025, Bitcoin was around $85,000. So, yes, Bitcoin is volatile, but as Michael Saylor, President of Strategy (formerly MicroStrategy) says, “the Bug is a Feature“.
Everyone was expecting 2025 to be a banner year for Bitcoin since it was the year after the halving (when “mining” becomes twice as difficult, reducing supply). Typically, the first year after the halving is good to great, and then the second year after the halving is poor. We can see that in the following chart.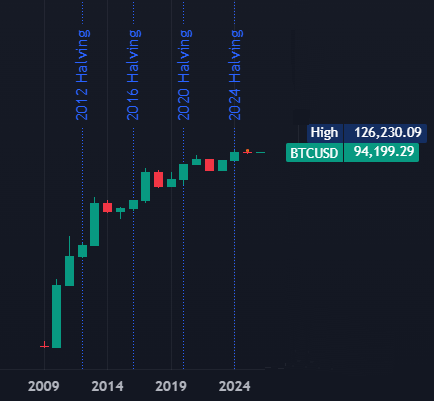
But in 2025 (the year after the halving), instead, the price of Bitcoin finished very slightly below where it started the year. So, many people are saying that the 4-year cycle is broken. Remember this chart is in logarithmic scale, so the percentage gains appear proportional, but the dollar values don’t. But if we look at the chart on a weekly basis instead of an annual basis, we get an entirely different (and more accurate) picture.
 Shameless Plug: As you can see, we use TradingView to create many of our Crypto charts.
But TradingView does much more than that. It also has real-time market data on Stocks, Indexes, Forex, etc.
You can easily add indicators and format your chart exactly to your liking.
Check out TradingView Free here.
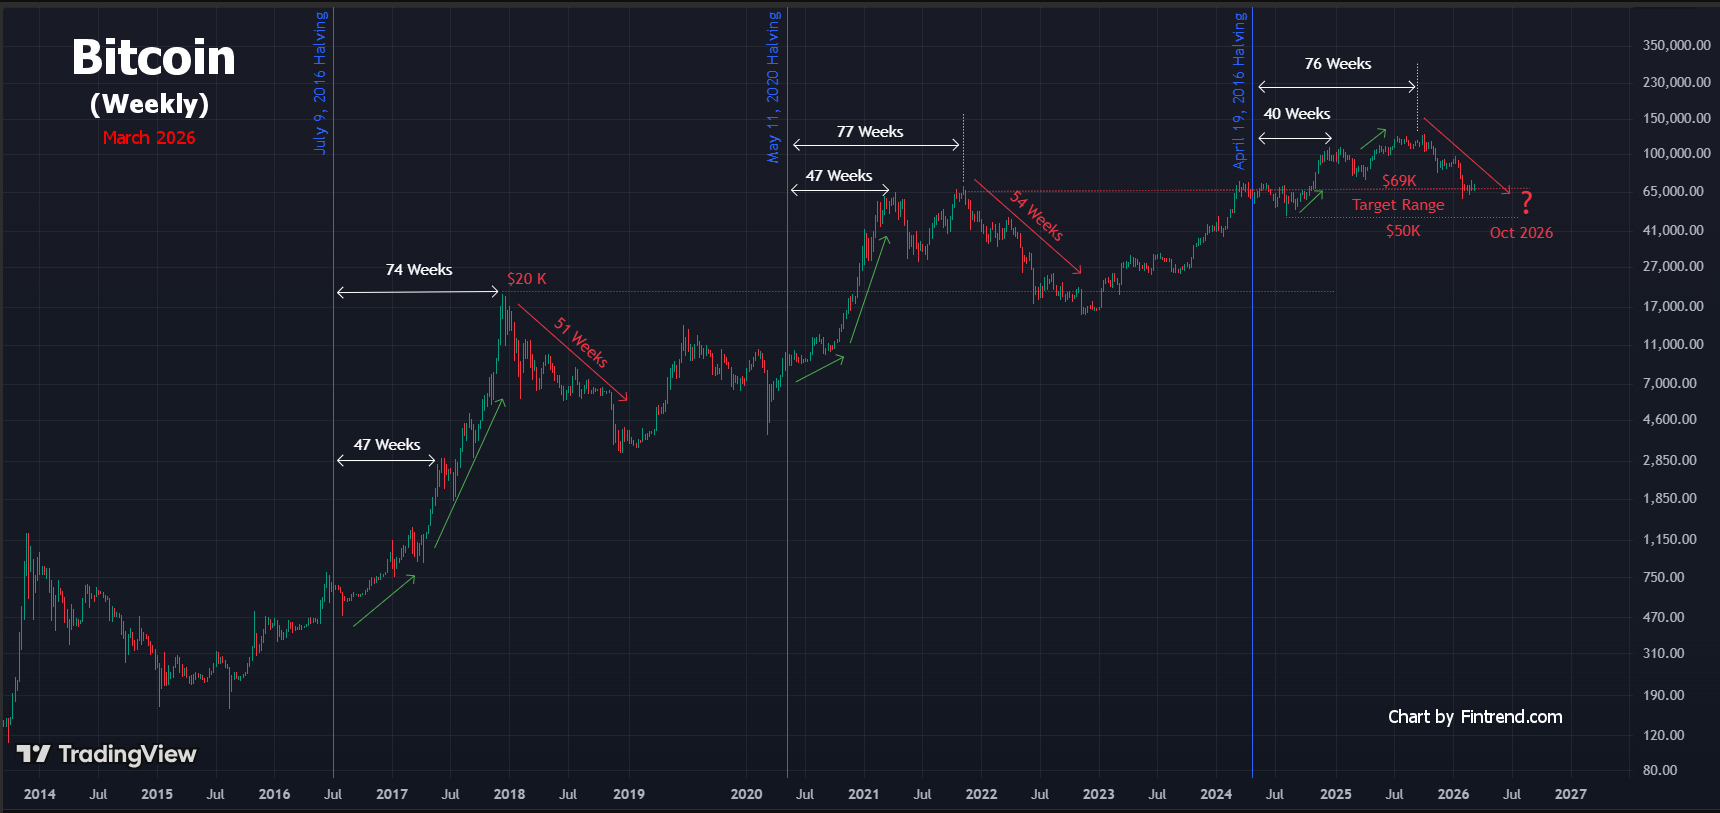
There is a lot of information in this chart. First of all, we see that typically price starts out moving up slowly after the halving, and then it accelerates upward in 2016 and 2020. It makes a slight peak around 47 weeks, and it finally peaks at around 75 weeks. In 2024, it was flat initially, and then reached a peak at 40 weeks and a final peak at 76 weeks. So, that is actually right on schedule. What threw Bitcoiners off was that the 76-week peak wasn’t accompanied by mass euphoria and a massive “blow-off” top. This time, the reaction was much more muted, perhaps because of the euphoria in the Bitcoin community that surrounded Trump’s election and the creation of Crypto ETFs, so everything was shifted forward a bit. Another factor was the introduction of professional trading, which allowed shorting, which could have muted the topping reaction. Also, FED policy created massive liquidity in 2020 due to COVID, but was reducing liquidity in 2024-25 through Quantitative Tightening.
The next thing we see on the chart is that the previous two corrections lasted roughly 51-54 weeks, so we would expect the current bottom to end in October 2026. However, since the FED has now shifted to a looser monetary policy, the bottom could arrive sooner. And finally, we can see where bottoms usually occur. The 2023 bottom was slightly below the 2018 top and above the 2019 secondary peak. If that holds for the 2026 downturn, we should expect the price to bottom somewhere slightly below $69k (perhaps in the $50-65k range) sometime around October 2026. But it is possible that it will get to that level sooner, and then trade in a flat range or have a truncated down period. But, In our article, Did the Crypto Bear Market Begin in October 2025, we noted that legendary investor W.D. Gann was adamant that “Markets are a function of Time and Price”. He was convinced that markets have a rhythm that had to play out before the uptrend could continue. The W.D. Gann Master Stock Market Course
Bitcoin (BTC)
Sell Signal
BTC briefly bounced into Buy territory with the counter-trend rally, but we didn’t call a buy signal, and it is now back in sell territory. We are still expecting the final bottom around October.
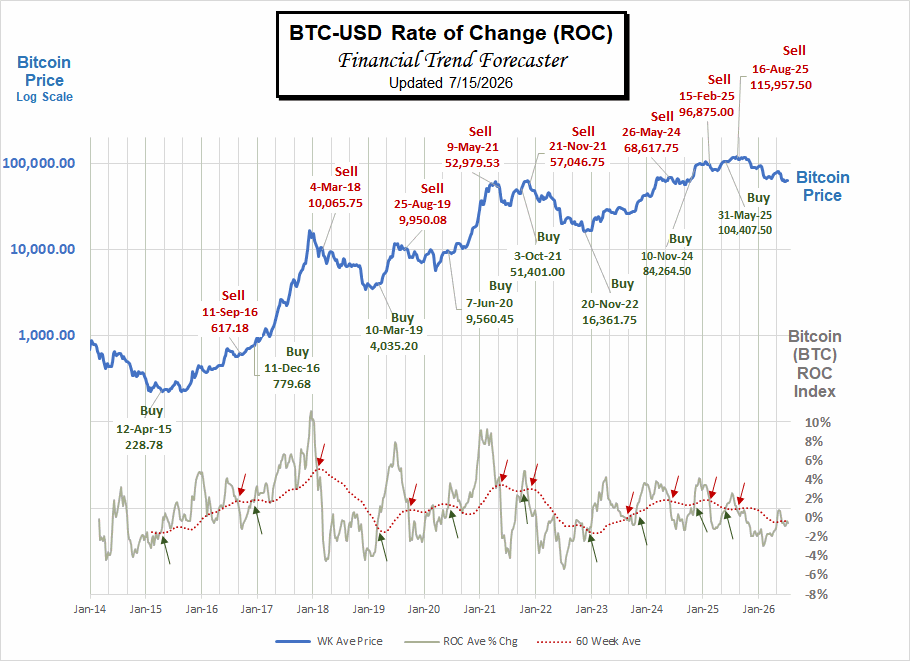
On August 16, 2025, our BTC ROC generated a Sell signal (with BTC at $115,957) as BTC ROC crossed below its dotted average line. BTC peaked a few weeks later at $126,110. For the short-term trader, that was an excellent time to reduce your BTC holdings.
As of this writing, Bitcoin is down from its $84.4k December bottom, to $70k currently. Despite our “ROC Sell Signal,” For diehard Bitcoiners who believe in the long-term narrative, the next several months could be viewed as a buying opportunity, perhaps via dollar-cost averaging or “Buy the Dips”. While those who are just in it to make a quick buck will whine and cry. This meme perfectly expresses that idea.

Fear & Greed Index
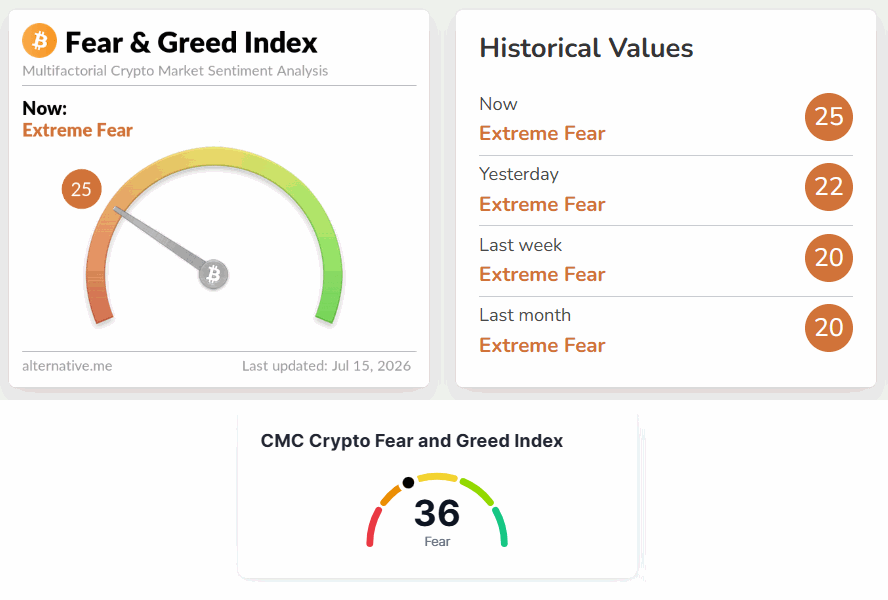
Based on Warren Buffett’s axiom “Buy when others are fearful and sell when others are greedy,” analysts have developed various fear and greed indicators for Bitcoin. This has proven a good indicator of when to buy, i.e., when the “Fear and Greed Index” is solidly in “Fear” territory. That occurred on March 10th at an “Extreme Fear” reading of 15, and once again on April 8th at the same level. Greed peaked in October 2025, around 74, still well below typical mania tops in the low 90s (see reasoning above for why the mania may not have occurred this time).
The Fear and Greed index shifted from a greedy 74 in October to a fearful 21 on November 4th. From there, it fell to single digits before rebounding to 24 on December 1, 2025. With fear at these levels, if governments, sovereign wealth funds, and corporations begin stacking Bitcoin in their strategic reserves, almost any point is a good buy point since BTC could easily quadruple over the next 5 years.
There are two different Fear and Greed indices. One from Coin Market Cap (CMC) and one from Alternative.me.
The CMC index is broader, measuring all of Crypto, while the Alt.me index focuses primarily on Bitcoin. Typically, they are very close, but this month they differ slightly.
Current Fear and Greed Widget updated Daily

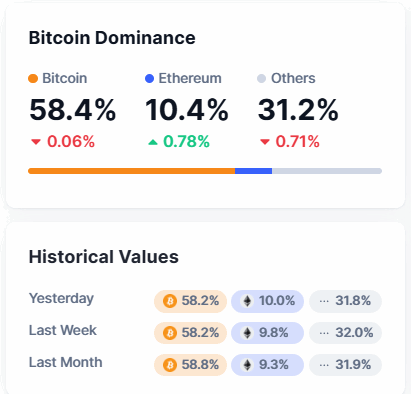
BTC Dominance
Bitcoin dominance is a metric that measures how much of the total cryptocurrency market value is made up of Bitcoin compared to all other coins combined.
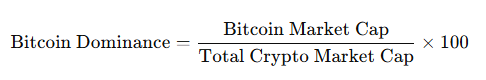
What is Bitcoin dominance?
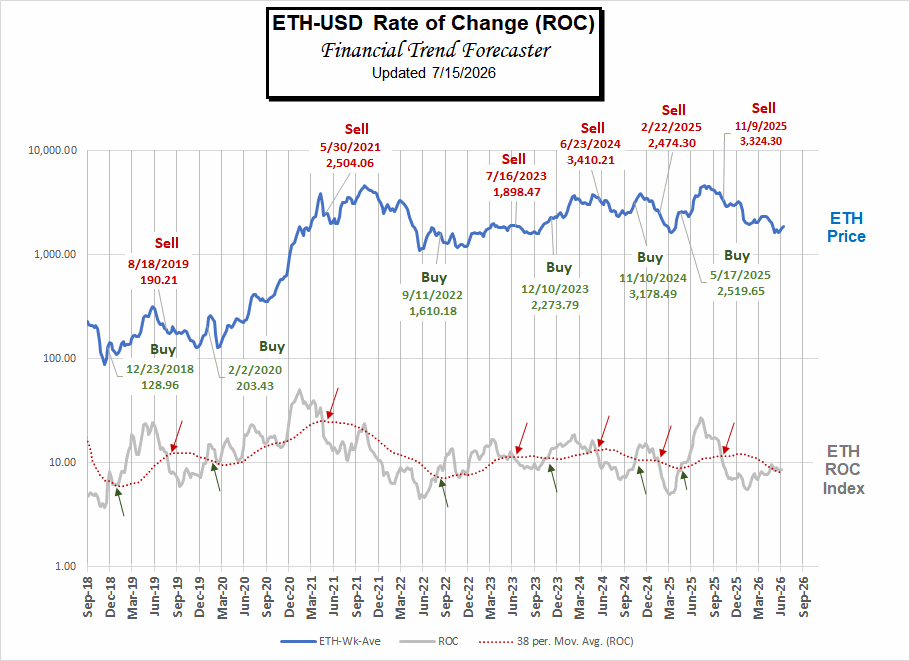
Ethereum (ETH)
Buy Signal?
As mentioned above, ETH dominance is rising, and the ETH ROC is barely in BUY territory as the index hugs the top of the moving average. If you are looking to ride the next bull wave, this might be a good place to begin tentative accumulation, perhaps by starting a dollar-cost averaging program.
 BTC vs. ETH
Bitcoin itself opened the floodgates for Crypto and decentralized finance (defi), but BTC functions almost entirely as an alternative currency. Ethereum has built on that foundation and is much more functional. Rather than being strictly a currency, Ethereum allows applications to be built upon its code to enable almost anything you can imagine to be done in a decentralized fashion. This makes ETH even more useful than BTC.
The one difference is that there is a limited supply of BTC built into the algorithm, but the same limitation is not built into ETH. But ETH does contain supply-limiting factors, which include “burning ETH” when it is used to provide services. So, when demand for ETH is high, the price rises. However, some changes to ETH to enable layer 2, temporarily created lower profitability for ETH, resulting in its decline in the first quarter of 2025.
At the time, I said, “ETH has suffered during this cycle as it faced competition from Solana, and it shifted its revenue model to allow for Layer 2 protocols to handle some of the load in order to increase transaction speed. I believe that at some point, ETH will recover its lost lustre as its usefulness becomes more apparent, but there is no guarantee when that will happen.” And that appears to be what happened.
Looked at simplistically, ETH is useful, and BTC is scarce. Recently, the FTC has determined that both BTC and ETH are “Commodities,” so we can think of them like the electronic versions of Silver vs. Gold, or perhaps even better, Copper vs. Gold. Just as Copper is necessary for all sorts of building, and Gold is a store of wealth, ETH is becoming necessary for electronic transactions, and BTC can be used as a store of wealth.
Crypto Stocks
There are several ways to invest in various cryptocurrencies via the stock market. On Wednesday, January 10, 2024, the Securities and Exchange Commission (“SEC”) approved the first U.S.-listed exchange-traded funds (ETFs) to track bitcoin. At that point, they actually approved several ETFs for Bitcoin. And subsequently, an Ethereum ETF was created, giving both cryptos access to increased liquidity. Recently, several of the big investment companies like BlackRock and Schwab have been rumbling about creating ETFs for other cryptos like Solana (SOL), Ripple (XRP), and Cardano (ADA).
Prior to ETF approval, a company called Grayscale had created “Trusts” that own a fixed amount of various cryptos and then sold shares of the Trust. Unfortunately, those shares often cost more than the underlying value of the assets the Trust held, often many multiples of the cost. For instance, at one point, Grayscale Solana Trust (GSOL) had a Net Asset Value (NAV) of $50.56/share. But it was selling for a whopping $425.00/share. That is insane. That would be like me walking up to a guy on the street and saying I have this beautiful $50 bill, and I will let you have it for only $425. No thanks!!!
But occasionally, it works the other way around when market sentiment turns negative. For instance, on 7/7/2024, there were three Grayscale funds that were selling at a discount. They were Grayscale Ethereum Trust (ETHE), Grayscale Ethereum Classic Trust (ETCG), and Grayscale Digital Large Cap Trust (GDLC). You can view all the current Grayscale NAVs and current prices here.
Another way to invest in Crypto besides an ETF or a Trust is through a company that holds a significant portion of the assets on its balance sheet in Crypto. The biggest example is Microstrategy, which we discussed at length in our article What Makes Microstrategy Special.
Coinbase is the largest Crypto Trading platform in the U.S. It works like a brokerage account and offers trading of a large selection of cryptos. You can find more information about it here. (Follow our link for signup bonuses and incentives.)
You might also like:
- Energy Is Non-Fungible: Costing the World Billions
- The Modern Day Wild West: Crypto Scams And Opportunities
- Blockchain Goes to Ethiopia
- Ripple the Cryptocurrency of Banks
- 4 Investments Making Waves in the Technology Sector
- How High Inflation Drives Countries Towards Crypto
- Can Crypto Solve Venezuela’s Hyperinflation Problem?
- Cryptocurrencies and Inflation
- Cryptocurrency: Is Bitcoin the Future of Money?