Early September is very important for the financial markets; especially for the bulls. Numerous elements are in place for a rally to take hold now. The markets have been weak and the bears have been in control. If the bulls cannot make a stand soon, it will be a bad sign for risk assets. The good news for the bulls is several factors, across numerous markets and asset classes, are pointing to a possible rally in risk assets:
- Bearish sentiment is high at the moment. Sentiment, especially as it approaches extremes, can serve as a contrary indicator.
- The Fed has signaled they are willing to print more money if needed. Right, wrong, or indifferent, the markets are anticipating more quantitative easing from the Fed. The Fed’s next meeting is only three weeks away. Markets look forward. A rally in risk assets for a few weeks is not out of the question.
- Currency and interest rate markets are acknowledging the possibility of the Fed cranking up the printing presses. In recent weeks, the U.S. dollar and the 10-Year Treasury have been firmly in the bears’ camp, but they are sitting near logical points of reversal. Recent rallies in the 10-Year Treasury have been showing signs of fatigue, which also points to a possible reversal in interest rates.
- Better than expected manufacturing data from China and better than expected growth in Australia have been reflected in the copper market. Emerging market stocks closed yesterday at a logical point of reversal; this morning’s news from China and Australia could spark a rally.
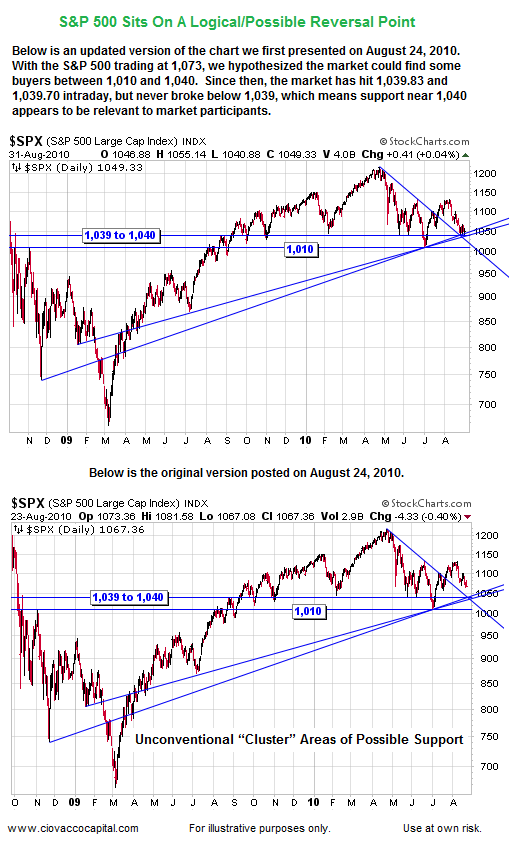
- Despite weeks of disappointing news on economic progress in the United States, the S&P 500 and Dow have yet to revisit their June lows, which is hard to believe given the recent lack of interest from buyers. When markets do something you do not expect, it is time to pay attention.
- Monday’s sell-off appeared to be a win for the bears, but unlike recent down days for stocks, total market volume contracted relative to the volume during Friday’s Fed-induced and broad-based rally. The S&P 500 and Dow have both held at logical reversal points.
Since a picture is worth a thousand words, we can show most of these concepts on the charts below. When you examine the charts, ask yourself, “Based on the actions in the past from market participants, is it logical for this market to reverse near current levels?” If the answer is yes, then the next thing to look for is some confirmation from the markets, which can come in the form of market breadth (advancing issues vs. declining issues), volume, and whether or not a broad cross section of markets are moving in the same direction (stocks, commodities, interest rates, currencies, etc). This analysis was completed after Tuesday’s close (8/31); so none of Wednesday’s (9/1) gains are reflected.
Below is an “after” and “before” chart showing an area of a possible reversal for the S&P 500.
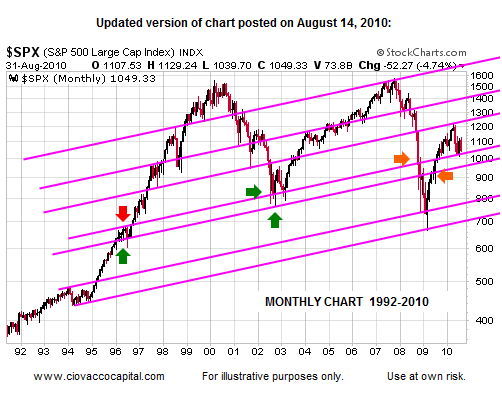
When markets across different time frames support the possibility of a reversal, the odds of the reversal taking place increase. The charts above cover 2009 and 2010. The chart below goes all the way back to 1992.
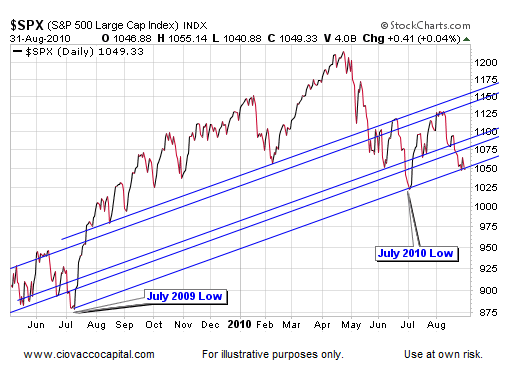
Another look at the S&P 500 supports the possibility of a sustainable rally in risk assets
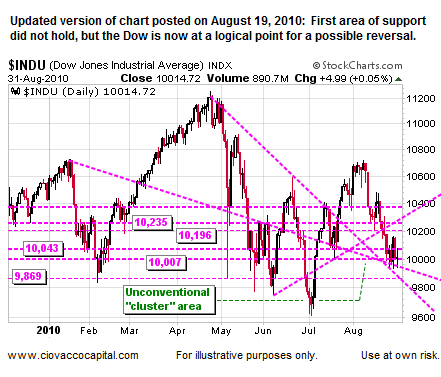
The Dow contains dividend-paying stocks; an area of interest for many investors in the current low-rate, low-growth environment. We, too, are interested in adding some dividend payers to our playbook should risk assets be able to hold near current levels. Industrial stocks appear to have found buyers near an area where three pink lines intersect. Two of the lines are trendlines and the third is a line of possible support. Three is better than one in terms of the probability the lines will be meaningful in the current day.
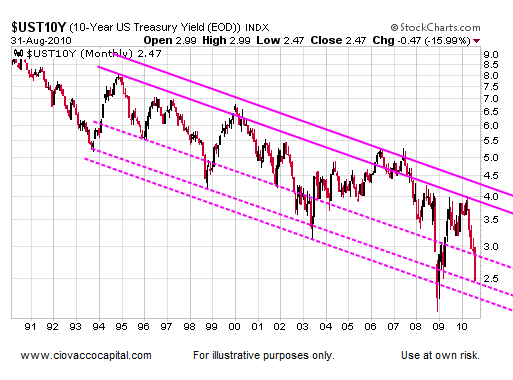
We hear lots of talk of a bond bubble. Bubbles can last much longer than many expect. Therefore, calling an end to a rally in bonds may be premature relative to long-term time horizons. However, a short-to-intermediate term reversal in bonds seems logical given the extreme bullish sentiment toward bonds and recent activity in the 10-Year Treasury. The yield on the 10-Year Treasury (shown below) has reached a point where reversals have occurred in the past (buyers became less interested). If you examine the daily chart of the 10-Year yield, numerous technical indicators are showing a weakening downtrend for interest rates, which again supports a possible reversal in rates and more conservative bonds.
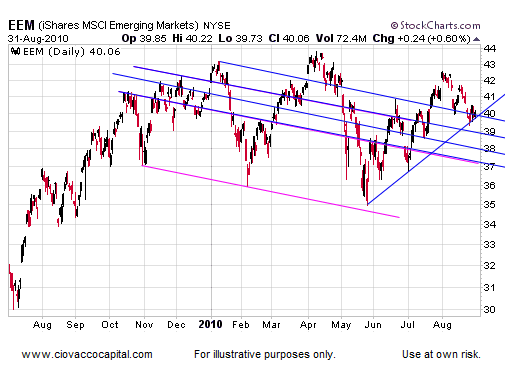
We mentioned the good economic news from China and Australia that was released this morning. Emerging market stocks appear to be at an advantageous position on the charts to capitalize on the fundamental support. We will look for confirmation from market action over the next few days. No need to guess.
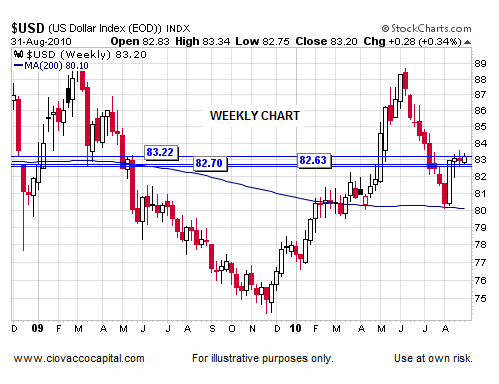
The U.S. dollar continues to perform the ironic role of a “safe haven” currency. As a general rule, when risk is out of favor, the dollar is strong. When risk is in favor, the dollar reverses. The dollar’s position as of Tuesday’s close also supports a good starting point for a sustainable rally(a few weeks or more) in all risk-related asset markets.
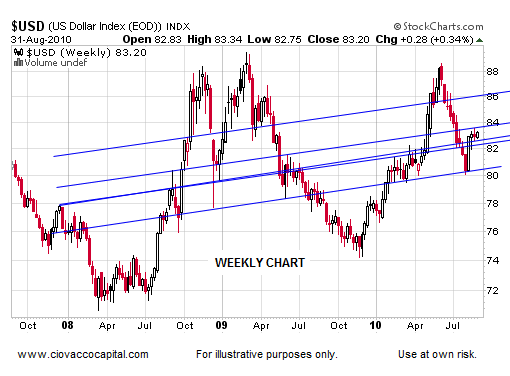
Another timeframe on the dollar (weekly chart going back to late 2007) also shows a market in the neighborhood of resistance.
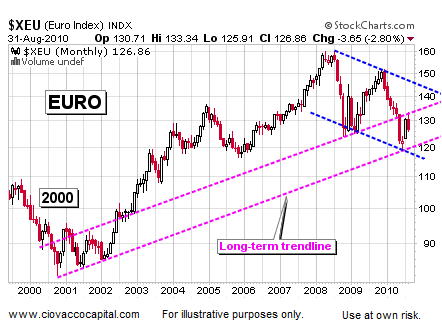
The euro could be eyeing a possible move toward 140; especially if it can find a way above 133.34.
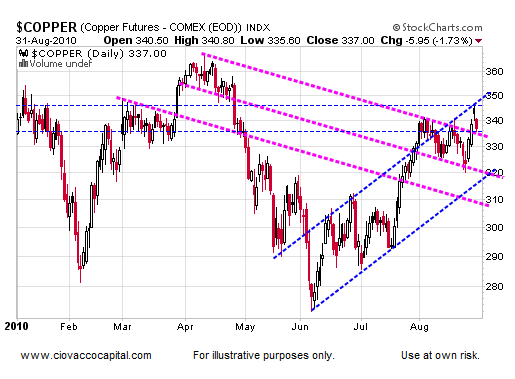
Despite months of worse than expected economic news from around the globe, copper is closer to its 2010 high than its 2010 low. The next few days are important for copper. Like the market for Treasuries, copper’s recent gains have shown signs of fatigue. If copper cannot hold above 337, a move back toward 320 to 325 could be in the cards (or worse). Copper may be an excellent way to monitor all markets for the next few days and weeks. If copper can break to the upside (above 346), the move would lend credibility to any rally attempt in risk assets. If copper fails near 346, especially in a decisive manner, then we would become more skeptical of any bullish move in the risk markets.
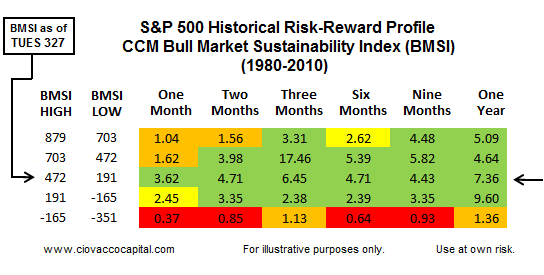
Our primary bull/bear model also shows the current market profile aligns well with past markets that more often than not were able to rally from very weak conditions.
The fact that conditions are ripe for the bulls to stage a rally does not mean they will necessarily seize the moment. Our job is to be prepared should more fundamental and technical data surface in support of the “rally in risk” scenario. Friday’s rally was a good first step for possible bullish outcomes over the next few weeks. Another strong day of gains would serve as further confirmation of a possible bullish turn in the short-to-intermediate term. Even if a rally can take hold, incoming data and actions from the Fed (or lack thereof) will most like dictate longer-term outcomes in what continues to be a “prove it to me” market.
After Friday’s impressive gains, we conducted some research looking for possible “rally assets”. Our findings are shown in Monday’s post, Markets Looking for Follow Through to Friday’s Rally.
Chris Ciovacco
Ciovacco Capital Management

Chris Ciovacco is the Chief Investment Officer for Ciovacco Capital Management, LLC. More on the web at www.ciovaccocapital.com
Terms of Use. The charts and comments are only the author’s view of market activity and are not recommendations to buy or sell any security. Market sectors and related ETFs are selected based on his opinion as to their importance in providing the viewer a comprehensive summary of market conditions for the featured period. Chart annotations are not predictive of any future market action rather they only demonstrate the author’s opinion as to a range of possibilities going forward. All material presented herein is believed to be reliable but we cannot attest to its accuracy. The information contained herein (including historical prices or values) has been obtained from sources that Ciovacco Capital Management (CCM) considers to be reliable; however, CCM makes no representation as to, or accepts any responsibility or liability for, the accuracy or completeness of the information contained herein or any decision made or action taken by you or any third party in reliance upon the data. Some results are derived using historical estimations from available data. Investment recommendations may change and readers are urged to check with tax advisors before making any investment decisions. Opinions expressed in these reports may change without prior notice. This memorandum is based on information available to the public. No representation is made that it is accurate or complete. This memorandum is not an offer to buy or sell or a solicitation of an offer to buy or sell the securities mentioned. The investments discussed or recommended in this report may be unsuitable for investors depending on their specific investment objectives and financial position. Past performance is not necessarily a guide to future performance. The price or value of the investments to which this report relates, either directly or indirectly, may fall or rise against the interest of investors. All prices and yields contained in this report are subject to change without notice. This information is based on hypothetical assumptions and is intended for illustrative purposes only. PAST PERFORMANCE DOES NOT GUARANTEE FUTURE RESULTS