Energy independence is the idea that a country produces as much or more energy than they consume. This does not necessarily mean that they don’t import any energy, simply that exports exceed imports. The U.S. passed this goal in 2019 for the first time since 1957.
Why is Energy Independence Important?
Historically, access to energy has been of strategic importance as countries that are not energy independent are subject to embargos, shortages, and political blackmail. According to EnergyPost, “we live in an energy-centric world where control over oil and gas resources (and their means of delivery) translates into geopolitical clout for some and economic vulnerability for others… the struggle over energy resources has been a conspicuous factor in many recent conflicts, including the Iran-Iraq War of 1980-1988, the Gulf War of 1990-1991, and the Sudanese Civil War of 1983-2005… look more closely and you’ll see that each of these conflicts is, at heart, an energy war.”
In years past, wars were fought over land that produced oil and gas, but more recently we have seen battles like those in Ukraine where the battle was for the land that held pipelines transporting the gas. So, one reason that being energy independent is so important is that it makes your country more secure. But it also makes it less susceptible to price increases.
In 1920, the U.S. produced almost two-thirds of all global oil. By 1945, US production had increased to slightly over two-thirds. The US was energy independent for the next 10+ years, but by the late 1950s, it was importing 350 million barrels per year, mostly from Venezuela and Canada. During this time the Middle East countries were able to develop and extract oil much more cheaply than the U.S. And by 1973, US production had declined to only 16.5% of global output.
In 1973-74, OPEC (the Organization of Petroleum Exporting Countries) increased oil prices by 300% partially in response to support of Israel by the U.S., Canada, Japan, the Netherlands, and the UK. In an effort to prevent this from happening again, in 1975, the U.S. created the Strategic Petroleum Reserve (SPR). It is the largest emergency supply in the world and uses underground salt caverns in Louisiana and Texas to store the oil. They have a maximum capacity of 797 million barrels (126,700,000 m3) and as of January 1, 2021, held 638.1 million barrels. Over the years, the SPR has been used to buy and sell crude oil in an effort at times to mitigate shortages and keep prices down and at other times to actually keep prices up to prevent bankruptcies of oil producers (and replenish the supply at lower prices).
Presidential Actions
Over the years oil has been a political football and a cause for contention. President Eisenhower created import quotas on oil in an effort to protect domestic producers. Some considered this a “Drain America First” policy and simply a way to benefit American producers but others saw the strategic benefit of not bankrupting American producers and thus leaving the U.S. at the mercy of foreign producers.
Other Presidential actions have also had an impact on national energy policy including the creation, filling, draining, and replenishing of the SPR. The technological advent of fracking has been at times controversial for Presidents, but it is the primary factor that has allowed the U.S. to become energy independent once again. The Keystone Pipeline as designed is to run from Alberta, Canada to the oil pipeline distribution center in Cushing, Oklahoma. It has been called an environmental disaster by some, but American Petroleum Institute (API) President and CEO Mike Sommers recently said, “revoking the Keystone XL pipeline is a significant step backwards both for environmental progress and our economic recovery. Pipelines are the safest, most environmentally friendly way to transport energy, and the economy cannot recover at full speed unless we deliver reliable energy from where it is to where it is needed.”
Where is Energy Headed Now?
According to the Institute for Energy Research total energy production increased by 5.7% in 2019 while demand fell by 0.9%. In 2020, the U.S. exported more crude oil than it imported for the first time since the Energy Information Administration (EIA) began tracking it in 1949. But all that may be coming to an end as Biden’s executive order has placed a freeze on oil and gas leases. This has resulted in at least one lawsuit by the Western Energy Alliance claiming that Biden has exceeded his authority. Texas Governor Greg Abbott has vowed to oppose what he calls the Biden administration’s bid to destroy oil and gas jobs.
The U.S. Energy Development Corporation has said that Biden’s policies will probably have more of an impact in the long-term than in the short-term “Because there are existing permits in place, the impact will not be felt immediately… however, long-term these decisions will ultimately force U.S. production to decline over the next several years and cause greater dependence on foreign oil in the future.”
Some experts believe that a shift toward Solar and Wind power will be able to take up the slack. In the following chart, we can see electricity generation by source.
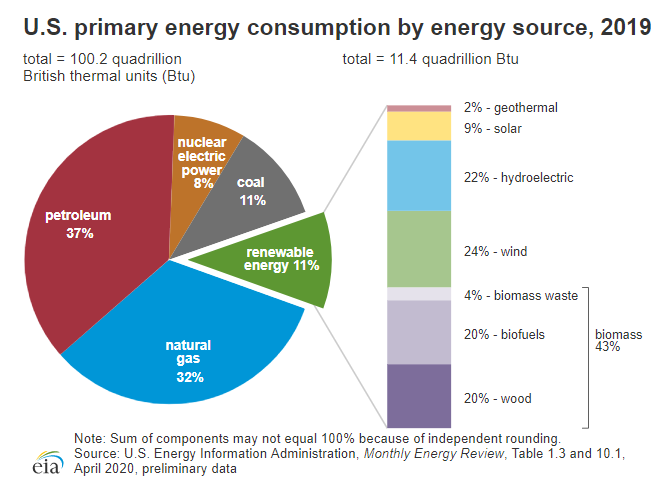
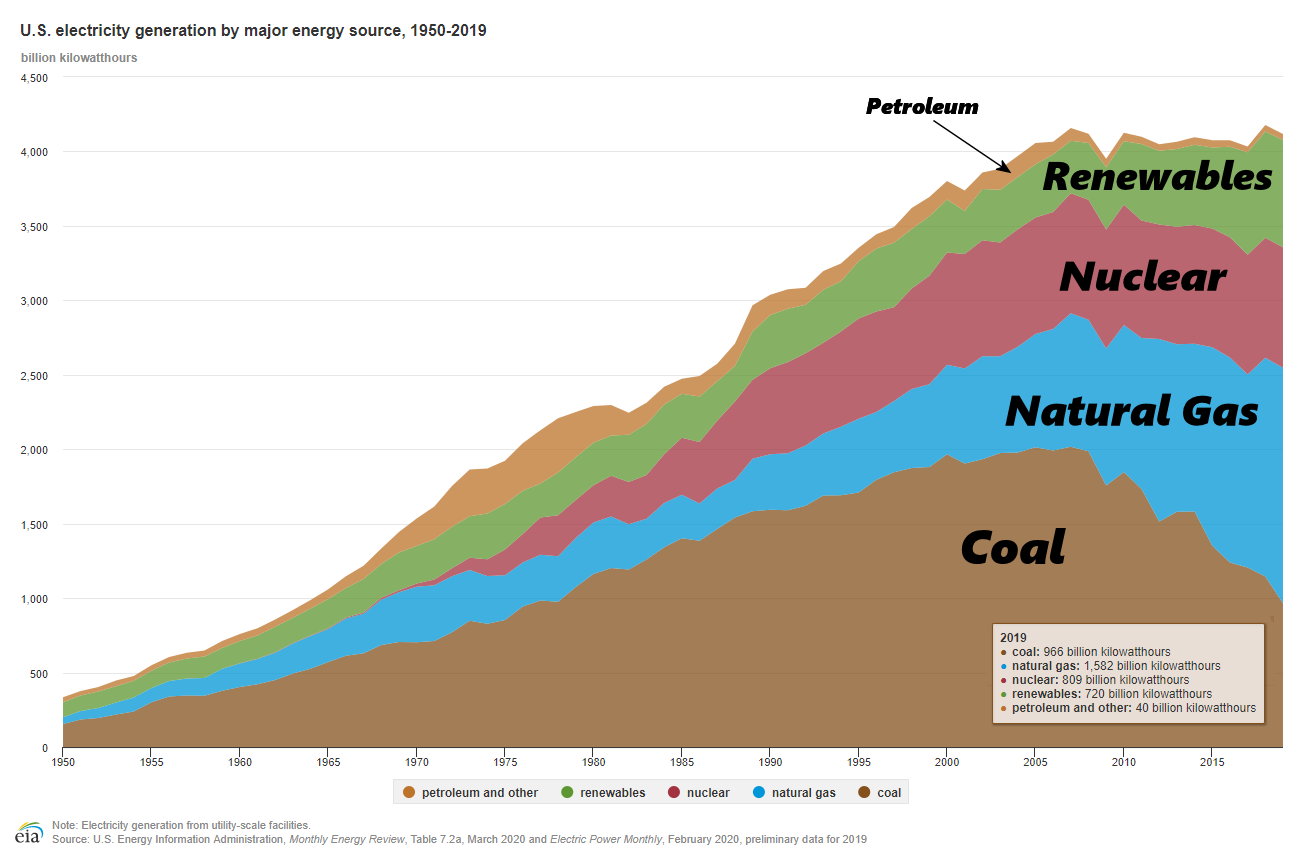 As we can see, up until 2005 the primary source of electricity generation was coal. Since then natural gas, nuclear, and renewables have taken a bigger slice of the pie but overall consumption has been fairly level. Petroleum never played a major part in electricity generation. While “renewables” even back in 1950 were a significant factor. How can that be, since photovoltaics and wind power didn’t exist? The primary source of renewable power then was hydroelectric. Looking at all energy usage (not just electricity) we see that petroleum still constitutes over 1/3rd of all energy production primarily for transportation and heating (heating oil).
If all vehicles were converted to electric and powered by renewable energy, renewable energy production would have to quadruple from current levels. And if you don’t want to dam up absolutely every river in the country (not only a physical impossibility but also an environmental nightmare and massive loss of landmass) wind, geothermal, and solar would have to increase by a factor of 12x. In 2016, wind turbines alone killed over 234,000 birds. Increasing wind turbines by a factor of 12 would mean the death of over 2.5 million birds a year. And depending on the type of solar not all solar is safe for birds either. The Mojave Desert solar plant alone kills 6,000 birds a year.
If we wanted to eliminate all of the natural gas usage as well, (which constitutes slightly less than 1/3rd of the total energy produced) we can see the magnitude of the problem and the unintended consequences of land usage, bird deaths, and sheer magnitude of the problem.
The following list shows where natural gas is used:
- electric power 36%
- industrial 33%
- residential 16%
- commercial 11%
- transportation 3%
The final problem facing renewables is that of storage. Unfortunately, unlike fossil fuels, renewable energy has to be produced when it is available. Solar must be produced when the sun is shining, wind power when the wind is blowing, and hydro when the reservoir is full but not too full. So rather than storing the fuel you have to store the energy this requires either chemical batteries or water storage ‘batteries”. This is generally more expensive and less efficient than storing fuel for traditional power plants.
Water “battery” systems use surplus energy to pump water to an upper reservoir when demand is low and allow it to flow to a lower reservoir when demand is high. A good example of this type of “battery” system is the Blenheim-Gilboa pump storage system in Upstate New York. It is roughly 73% efficient, meaning that 27% of all electricity stored is lost.
Chemical batteries have problems of their own including mining the storage medium such as lithium. Chemical batteries have efficiency issues too. Lithium-ion (Li-ion) battery round trip efficiency is the amount of energy that the battery can deliver relative to the amount of energy injected into it during the immediately presiding charge. Lithium batteries have a much higher efficiency than water pump storage, with Li-ion batteries initially starting at 95% efficient (compared to lead-acid batteries which lose 20-25% of energy round trip). But they do not maintain this efficiency for their entire lifespan) average efficiency over their useful life is more like 80%. And then there are disposal issues at the end of the battery life.
Economics of Renewables
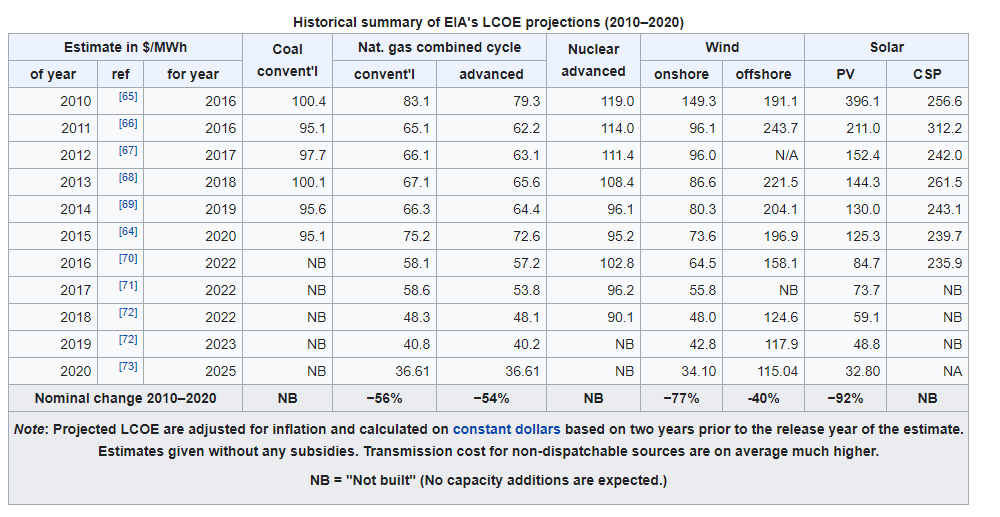
Obviously, initial construction costs are not a fair way to calculate cost comparisons between renewable and non-renewable generating facilities. So the government has developed what they call Levelized Cost of Energy (LCOE). This measures lifetime costs divided by energy production. It calculates present-value of the total cost of building and operating a power plant over an assumed lifetime. And allows the comparison of different technologies (e.g., wind, solar, natural gas) of unequal life spans, project size, different capital cost, risk, return, and capacities. The following table shows the EIA’s estimated LCOE five years in the future beginning in 2010. So back in 2011, the EIA was estimating that by 2016 the cost of 1 MegaWattHour of production capacity of coal was $95.10, a Natural Gas plant would cost between $62.20 and $65.10, Nuclear was much more expensive at $114.0, Wind onshore was cheaper than Nuclear but still 50% more than Natural Gas and Offshore Wind was almost 4x more expensive than Natural Gas and Solar was up there with offshore wind.
But now the EIA is projecting that in 2025 Onshore Wind and Photovoltaic Solar will be competitive with Natural Gas.
Other Factors
We often think that once renewable energy producers go online they will continue to produce free energy forever. But unfortunately, that is not the case. Apparently, wind-turbine blades only last 20-25 years and so the early wind-turbines are already reaching the end of their lifespan. A Bloomberg Green article titled “Wind Turbine Blades Can’t Be Recycled, So They’re Piling Up in Landfills.”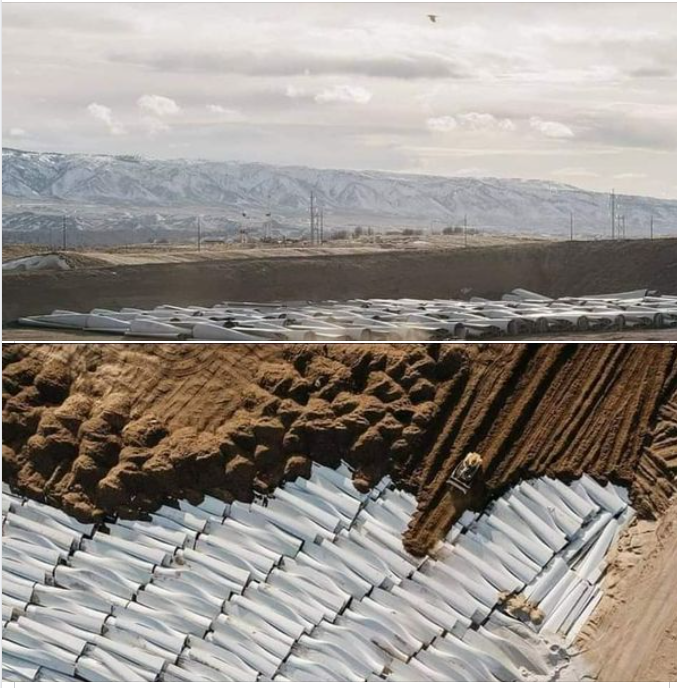
A wind turbine’s blades can be longer than a Boeing 747 wing, so at the end of their lifespan they can’t just be hauled away. First, you need to saw through the lissome fiberglass using a diamond-encrusted industrial saw to create three pieces small enough to be strapped to a tractor-trailer…
The John Locke Foundation has been warning about the surge of waste that will come as the unintended consequence of these “clean” energy sources. JLF published a research brief by Nick Wilkinson about the cost of wind turbines where he states:
Wind turbine blades, which are several hundred feet long, are difficult to transport, and even more difficult to dispose of. In order to be transported to landfills, blades have to be cut into smaller pieces and then loaded on to trucks. This process is difficult and expensive enough. However, the blades still have to be crushed down. To make matters worse, many landfills lack the equipment necessary to crush the blades meaning they’re unable to dispose of them efficiently.
The environmental effects of Wind Turbines also include leaking oil which can be scattered across large areas, climate change due to shifted wind patterns, land use which may require cutting trees, impacts on wildlife, safety, etc.
As Thomas Sowell tells us “There are no solutions only trade-offs”.

You may also like: