U.S. Credit Card Debt Plummets in 2020-2021
After a record-setting year for credit card debt reduction in 2020, U.S. consumers maintained their strong performance during the first quarter of 2021, paying off $56.5 billion in credit card debt, according to the personal-finance website WalletHub’s latest Credit Card Debt Study.
Although credit card debt levels are becoming more manageable nationwide, some areas have bigger payment problems than others. With that in mind, WalletHub compared more than 180 of the largest cities based on how much residents owe to credit card companies – specifically, how those balances changed in Q1.
Cities with the Biggest Debt Paydown
- Santa Clarita, CA
- New York, NY
- Chesapeake, VA
- Chula Vista, CA
- Pembroke Pines, FL
- Pearl City, HI
- Santa Ana, CA
- Virginia Beach, VA
- Rancho Cucamonga, CA
- Plano, TX
Cities with the Smallest Debt Paydown
- Fargo, ND
- Buffalo, NY
- Akron, OH
- Cedar Rapids, IA
- Milwaukee, WI
- Toledo, OH
- Cleveland, OH
- Lewiston, ME
- Madison, WI
- Detroit, MI
Credit Card Debt Study Key Stats:
- Continued Debt Reduction. Credit card debt decreased by $56.5 billion during Q1 2021, following a record paydown of $82.1 billion in 2020.
- Bigger Paydown Than Normal. Consumers’ Q1 2021 CC debt paydown was 51% larger than the post-Great Recession average for a first quarter.
- Rising Charge-Offs. At 2.95% for Q1 2021, the credit card charge-off rate is up by 14.3% compared to last quarter.
- Ease Your Debt. The best balance transfer credit cards currently offer 0% APRs for the first 15-20 months with no annual fee and balance transfer fees as low as 3%.
Although the ability to reduce credit card debt is a good thing it could be related to the increase in government checks sent to almost everyone. Wise consumers could be using the windfall to pay down debt rather than just using it to buy another big-screen TV. Or it could be that due to the quarantine consumers just didn’t go out and spend so they used the money they used to waste, to pay down debt.
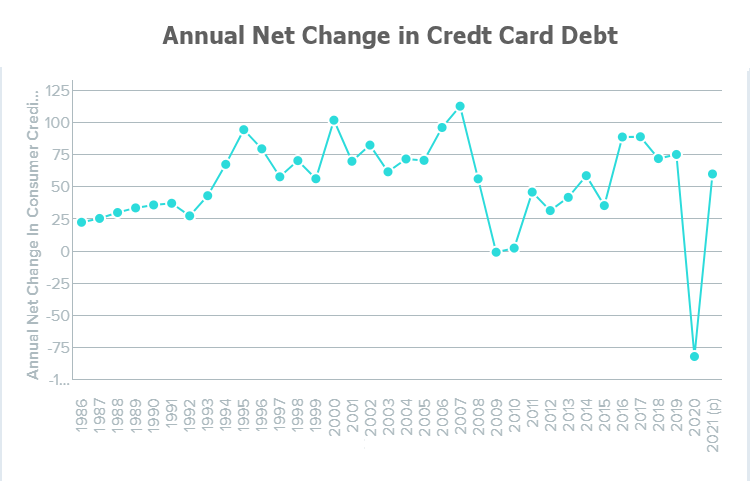
But although the first quarter was down, the trend might be over, due to the government handouts and quarantines ending. As we can see from the chart below, Wallet Hub is estimating that CC debt for the whole year will actually show an increase of over 50%.
Another possible negative lurking in the statistics is the increase in the “Charge-Off Rate”. According to Investopedia, “The credit card charge-off rate is a measure that shows the percentage of defaulted credit card balances in comparison to the total amount of credit outstanding. Credit card companies track credit card charge-off rates to monitor the performance of their credit card loans. Across the industry, a credit charge-off rate can also be calculated comprehensibly to show the total percentage of credit card balances in default.”
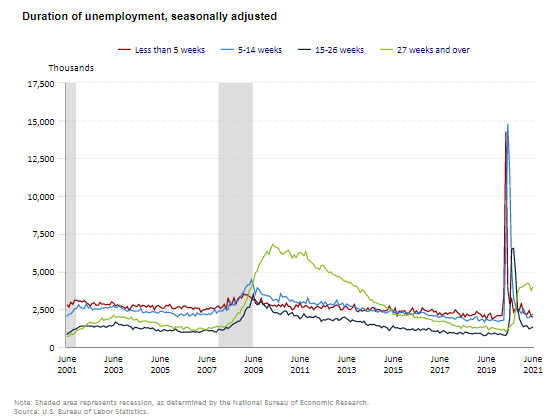
So although more people are paying down their debt, defaults are actually rising. This could also be the result of the pandemic layoffs. People who were were unable to work from home lost their jobs and companies closed. So although the unemployment rate is down as some companies were able to reopen. June Unemployment was still 5.9% with those who are unemployed for more than 27 weeks still extremely high.
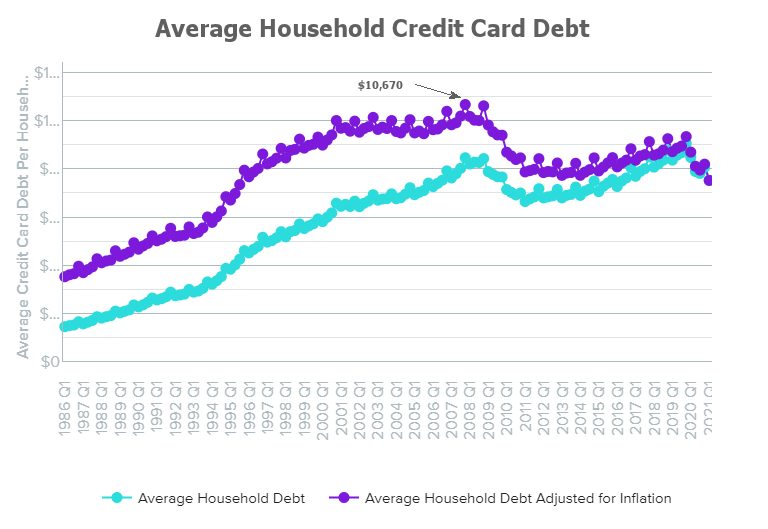
Average Credit Card Debt per Household
Household and Total CC debt decreased in 2020 and the first quarter of 2021.
| Q1 2020 | Q1 2021 | % Change | |
| Average CC Debt per Household | $8,694 | $7,519 | -13.5% |
| Total Credit Card Debt | $1,001.6 B | $892B | -10.9% |
| Quarter Net Increase | -$58.8B | -$56.5B | -4.0% |
With the average household having $7,519 in credit card debt in 2021 that is significantly below the peak in the 4th quarter of 2007 when the average household credit card debt was an inflation adjusted $10,670.
Credit Card Debt in Billions
| Period | Total Outstanding CC Debt (Billions) | Change In Outstanding CC Debt (Billions) |
| 1986 | $145.90 | $17.90 |
| 1987 | $166.20 | $20.30 |
| 1988 | $190.60 | $24.40 |
| 1989 | $217.80 | $27.20 |
| 1990 | $245.90 | $28.10 |
| 1991 | $271.50 | $25.60 |
| 1992 | $286.40 | $14.90 |
| 1993 | $318.50 | $32.10 |
| 1994 | $375.50 | $57.00 |
| 1995 | $455.60 | $80.10 |
| 1996 | $513.90 | $58.30 |
| 1997 | $544.40 | $30.50 |
| 1998 | $585.70 | $41.30 |
| 1999 | $614.90 | $29.20 |
| 2000 | $688.20 | $73.30 |
| 2001 | $720.40 | $32.20 |
| 2002 | $756.70 | $36.30 |
| 2003 | $774.60 | $17.90 |
| 2004 | $807.90 | $33.30 |
| 2005 | $839.50 | $31.60 |
| 2006 | $905.40 | $65.90 |
| 2007 | $981.60 | $76.20 |
| 2008 | $983.90 | $2.30 |
| 2009 | $897.80 | ($86.10) |
| 2010 | $822.30 | ($75.50) |
| 2011 | $823.40 | $1.10 |
| 2012 | $823.20 | ($0.20) |
| 2013 | $837.10 | $13.90 |
| 2014 | $869.60 | $32.50 |
| 2015 | $880.10 | $10.50 |
| 2016 | $940.90 | $60.80 |
| 2017 | $996.50 | $55.60 |
| 2018 | $1,032.80 | $36.30 |
| 2019 | $1,070.10 | $37.30 |
| 2020 | $955.10 | ($115.00) |
| 2021 (Q1 only) | $892.0 | ($63.1) |
The total credit card debt has only declined in four of the years from 1986-2020. The average increase has been almost $28 Billion a year. Although CC debt declined in the first quarter of 2021 wallet hub is projecting an actual increase for the entire year.
Total Debt
If we look at the total debt including housing, auto, and student loans, etc. we get a different picture. The chart below from the Federal Reserve Bank of New York (NY-FRB) shows that (as we would expect) housing makes up the vast majority of total household debt. And total debt did not decrease during 2020.
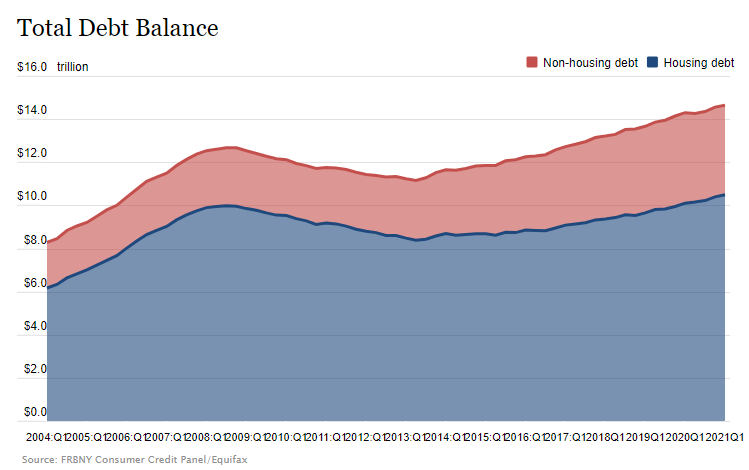
According to the NY-FRB:
- Balances on home equity lines of credit (HELOC) saw a $14 billion decline, the 17th consecutive decrease since 2016-Q4, bringing the outstanding balance to $335 billion.
- Mortgage balances increased by $117 billion in the first quarter of 2021, and stood at $10.16 trillion at the end of March.
- Credit card balances are $157 billion lower than they had been at the end of 2019, consistent with both paydowns among borrowers and reduced consumption opportunities.
- Auto loan balances increased by $8 billion in the first quarter.
- Student loan balances increased by $29 billion.
- In total, non-housing balances declined by $18 billion, with increases in auto and student loans offset by the declining credit card balance, and are now $49 billion below the 2019-Q4 level.
Q&A with WalletHub
What do the latest credit card debt statistics tell us about the health of U.S. consumers?
“The newest data on credit card debt indicate that U.S. consumers are in good shape financially. Consumers finished 2020 with a record annual paydown of $82.1 billion and picked up right where they started in 2021, shedding $56.5 billion in credit card debt during the first quarter,” said Jill Gonzalez, WalletHub analyst. “It’s common for credit card debt to drop during the first three months of the year, but the drop we observed this year is the second-largest ever, so we’re definitely on a strong trajectory.”
How will credit card debt levels look for the rest of 2021?
“Credit card debt will likely increase by around $60 billion during 2021, even after a $56.5 billion first-quarter pay down,” said Jill Gonzalez, WalletHub analyst. “It’s hard to imagine a scenario in which debt would not increase somewhat in the short term as the economy continues to reopen, extra unemployment benefits rollback, and consumers make up for lost time when it comes to spending.”
You might also like: