In his May True Wealth newsletter, Steve Sjuggerud said,
At the peak of an asset bubble, prices go “parabolic.” In a bubble, the asset’s chart goes from “humming along nicely” to “straight up.” A good example is the NASDAQ back in 1999-2000. In less than six months, the NASDAQ just about doubled before it peaked in March 2000. That was the parabolic stage for the Nasdaq.
Gold is still in the “humming along nicely” phase. It hasn’t gone parabolic yet. And then he went on to give some interesting statistical and some anecdotal evidence to prove his point.
However, In the following article Patrick W. Hejlik CEO of Fourth Quadrant Asset Management presents his arguments as to why Gold is in a bubble. As many long time readers know we have been bullish on Gold for a while. Patrick is a pretty smart guy managing assets to minimize risk while maximizing profits and I respect his investment acumen so it is interesting to note that he is currently holding gold puts (i.e. he is betting gold will decline sharply). So in the interests of presenting both sides of the debate I am presenting his reasoning here. Tim McMahon, editor.
Gold is in a Bubble
By Patrick W. Hejlik
Like many Wall Street expressions, the term bubble has been so tossed about in recent years that suggesting an asset class is in a bubble is akin to the boy who cried wolf. In an effort to set the record straight, a bubble in asset prices is when speculative forces overtake the fundamental underpinnings of an asset and drive prices to levels that are unsustainable when related to those fundamentals. Based on that definition, it is our opinion gold has reached this classification.
In 1999 gold was trading around a multi-decade low of $270 per ounce, the US dollar was popular, governments and currencies were competing freely and peacefully with each other and we could count on one hand how many people we knew who even owned gold. Those who were involved in gold at the time were largely related to jewelry and industrial uses with investment or speculative practices making up a very small portion of total de-mand. Twelve years later, however, we find ourselves on the other end of the spectrum. Gold is trading above $1500 per ounce, Utah has recently passed legislation making gold and silver legal tender and gold demand for investment and or speculative trade has exploded.
From our analytical viewpoint, anecdotal sentiment evidence is frothy, supply and demand fundamentals are weakening and relative valuations suggest gold has vastly overshot fair value. However, as John Maynard Keynes suggested in his famous aphorism ?markets can stay irrational longer than you or I can stay solvent.? This statement rightfully suggests the difficulty in timing when a bubble will ultimately pop. Fortunately finan-cial advancements from Keynes‘ day now allow an investor to monetize their thesis without being exactly right but just generally correct.
Gold Demand
When evaluating commodity demand we need to delineate the differences between demand and consumption. Gold is an unusual commodity in that it is one of the few materials dug out of the ground where the majority of it is never actually consumed (i.e. can not be reused). Sure, jewelry and gold bars are produced but only a small fraction is really consumed and never recovered. According to the World Gold Council, it is estimated that a total of ~165,000 tons of gold has been extracted from the planet of which approximately 85% is still in exis-tence today. Due to the high value of the metal true consumption really only occurs in industrial uses and even that is changing, as higher prices encourage more industrial recycling.
As for demand, which is the desire to accumulate and/or consume, in 2010 the World Gold Council estimated gold demand grew +9% y/y to 3812.2 tonnes and is +2.2% higher than in 2001. 2010‘s increase was mostly driven by increased jewelry demand but the primary reason gold demand has risen since 2001 is from investment related activities which has increased +273%. The positive is demand for gold is modestly higher since 2001, however, composition of demand has changed dramatically and in our opinion, not for the better. Prior to 2001, over 90% of global demand was used for jewelry and technology purposes while investment related utilization accounted for the remaining 10%. However, by 2010 demand had shifted in that 54% of gold demand was driven by jewelry, 35% for investment and speculative purposes and 11% for industrial uses like technology products and dental applications.
The change in demand demographics has moved from “stickier” to “looser” sources. What is defined as “sticky” and “loose” is a function of how fast supply and demand can change within each category. Supply and demand for jewelry is a slower moving process with creation and sale of a product taking weeks to months while investment related supply and demand can be affected in a matter of seconds. This creates a more volatile mar-ket place and one where risk increases extraordinarily.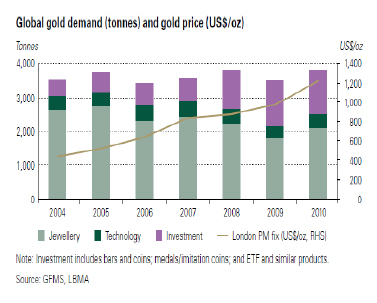
Jewelry Demand-
Jewelry demand led the way in 2010 with a +17% y/y increase that was primarily driven by China and India. While this appears to be a robust figure, troubling under currents are brewing. First, jewelry demand remains in a secular downtrend which has been caused by increasing prices of its main component. As illustrated by the chart below, demand has fallen –24.2% from 2005 levels and –31.5% below 2001 levels of 3009 tonnes (which is not shown). In addition, gold jewelry purchases are becoming more and more controlled by China and India as by the fourth quarter of 2010 the two countries comprised over 78% of total world demand for gold jewelry. United States, Japan, the Middle East, and Europe (which collectively make up the second largest group for jewelry demand) cut back purchases in the fourth quarter of 2010 versus 2009. This centralization of purchasing power is particularly troubling, as it is with any asset class, as a shrinking pool of willing buyers increases the risk of volatility and price declines.
Investment Demand-
 Throughout history, gold has been the ultimate backstop re-serve currency as it qualified on three basic premises: 1)It can be used as a blunt tool of exchange, 2)It has a standard of value and 3)It is a reserve of value. Now while gold can be technically used for exchange, it is hardly efficient to carry around and even settling large purchases with gold entail absorbing settlement and storage fees. So, you are really left with gold being a standard and a reserve of value, which is just a fancy way of saying it is there to protect you from a devaluation of purchasing power. It is not, as many want you to believe, a safe haven instrument to protect against economic downturns or a credit debacle like 2008. Price action and correlations to equities in 2008 aptly demonstrated this point as gold de-clined approximately -29.5% from March 17, 2008 through October 24, 2008 which was the heart of the crisis. The short term top in gold followed the collapse of Bear Sterns and its trough was very close to S&P lows in 2008 before it became clear the US government was going to throw the proverbial monetary and fiscal kitchen sink at the problem.
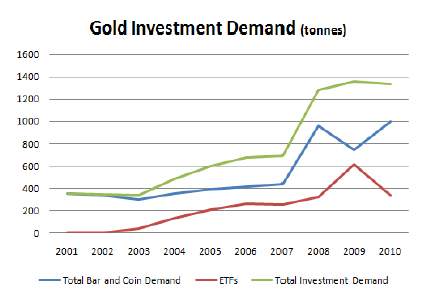
Today, investment related activities are channeled through gold coin and bar purchases as well as ETFs and similar vehicles. While jewelry demand has fallen precipitously since 2001, investment related purchases have made up the difference by increasing +273%. This increase in demand looks quite spectacular but similarly to jewelry demand, negative trends are hiding beneath the surface. In 2010, global investment de-mand actual fell -2.0% y/y as money came flood-ing out of ETFs and similar investment vehicles only to be mitigated by increasing gold coin and bar demand from India and China. Additionally, these two countries increased purchases by +66% y/y and ~+28% y/y respectively and as of the fourth-quarter of 2010 comprised over 63.5% of global gold coin and bar demand. This centraliza-tion of demand is not representative of a healthy market.
Industrial Demand-
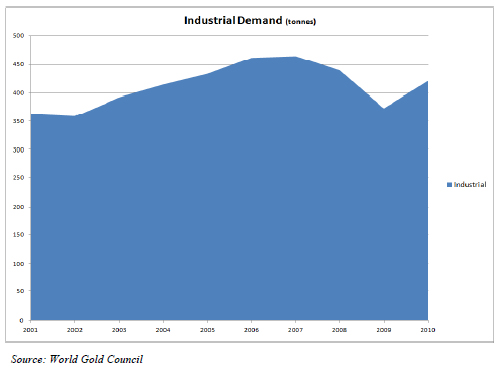 Industrial demand for gold posted a solid rebound in 2010, growing +12.7% y/y (chart below), as demand for technology products, industrial products and decorative segments in India were primary growth drivers. How-ever, by the fourth-quarter many industrial segments and technology applications were feeling the pinch of higher input costs and trying to replace gold applications with cheaper alternatives. According to the World Gold Council, the introduction of copper wire and palladium coated copper wire were making inroads into less sophisti-cated products and demand for industrial gold was flattening. Swapping out for less expensive materials is a natural eco-nomic reaction to higher input prices and will likely proliferate.
Gold Supply
Forecasting future gold supply is more difficult than most other commodities as generally speaking it never com-pletely disappears from the face of the earth. Its past use in jewelry fabrication, investment production and in-dustrial applications can reenter the supply chain at any time through recycling and make quantifying future supply onerous. However, the laws of supply and demand are clearly present and working, as gold supply re-sponded to higher prices in 2010 increasing approximately +5.4% y/y.
Global Mine Production-
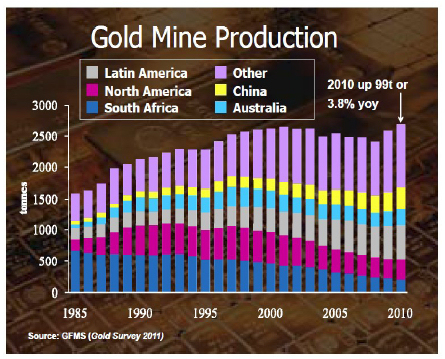 Global mine production, which makes up ap-proximately 63% of the total supply, increased +3.8% y/y in 2010 to a record level of 2689 tones and according to the GFMS 2011 Gold Survey mine production is expected to rise an additional 4% y/y in 2011. This is a result of a number of large start-ups projects ramping up production.
This trend is likely to continue as prices have escalated north of $1500 per ounce providing uncommon profit margins for producers lead-ing to a plethora of new exploration.
Recycling-
Much like mine supply, higher prices encour-age increased recycling. More families scour attics and dressers looking for old jewelry, improved scrapping technology and processes thought to be too expensive come on line to strip industrial products. The chart to the left depicts this relationship well as scrapping has experienced rapid increases in the last ten years and is a trend that is likely to persist.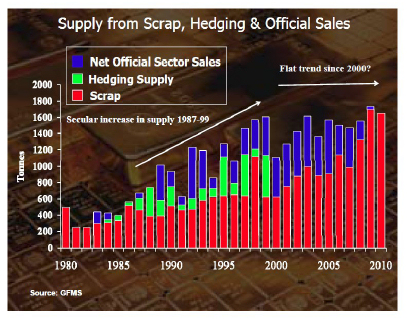
Official Sector Sales-
The official sector traditionally has been a net adder of supply by continuously selling bullion on a fairly planned schedule. However, this has changed recently as European Central Banks and the IMF have concluded planned sales of gold and China, Russia and others have been net acquirers of gold. While Emerging Market countries don‘t discuss planned purchases, it appears they are diversifying dollar reserves into gold bullion. The ultimate question is how far will they go and how fast. China, for example, recently announced they acquired over 400 tonnes of gold from 2004—2010 and now hold approximately 1.6% of it reserves in gold. Some have speculated an ultimate $1 trillion investment in gold by China which would be almost a 20x fold increase and place almost 30% of its reserves in gold at today‘s levels. We don‘t anticipate that type of investment, as the Politburo has never displayed that type of audacity and we don‘t expect them to start now. It is more likely the Chinese gov-ernment will continue to purchase gold at a measured pace until its gold to reserve ratio is between 5% – 10%.
Gold Valuation
Gold has no stream of earnings, no coupon or cash flow of any kind which make traditional valuation metrics useless in defining fair value. However, it is reasonable to observe metrics that appear to be economically sensi-ble when it comes to gold. For our purposes, we look at the cost of extraction versus spot rates and the rate of price growth versus CPI growth.
Cost of Extraction-
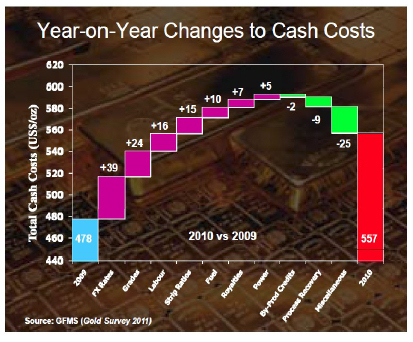 Over the longer term we believe most commodities revert back to their “mean” by ebbing and flowing around their cost of extraction levels plus some profit margin. The rationale is Econ 101 as large differences between extraction levels and spot prices tend to impact deci-sions by the largest natural suppliers (i.e. mining companies and recycling). When profit margins are high, more mining capacity is brought on line, when profit margins decline capacity is removed and or recycling does not make economic sense. Currently, according to GFMS all in cash extraction costs are averaging around $560 per ounce. We say approxi-mate because depending on company and country of mining capacity these costs can vary widely. With spot pricing around $1500 per ounce margins this large are uncommon and should be considered sub-ject to pressure from additional supply.
Price growth versus CPI growth-
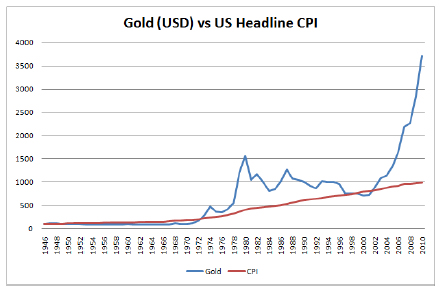 As mentioned earlier, it is our belief investing in gold really serves only one purpose and that is to hedge against a devaluation of purchasing power. That is it. It is not a safe haven or risk free asset. With that being said, in our estimation the best way to determine gold‘s value is to chart it against the growth of headline CPI. Over the long run, price increases in the metal should closely relate to CPI levels and deviations far above or below need to be studied carefully. The chart to the left is rebased as of 1946 and illustrates the relationship between US headline CPI and gold. It is readily apparent since 2000 that gold has vastly out-stripped the growth rate of inflation as loose monetary policies and BRIC commodity demand unleashed the golden genie. Early players who recognized the forces were richly rewarded but it now appears that gold has overstayed its welcome.
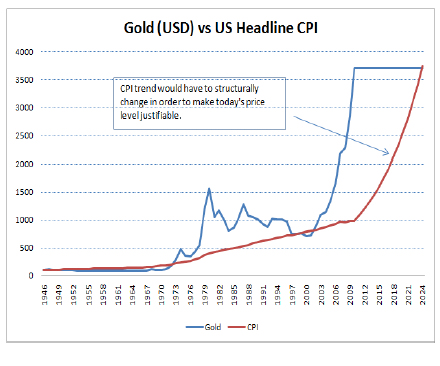 Now many have argued the current price of gold is a discounter of future inflation and in some re-spects this might be a valid argument. After all, the US has engaged in new and untested monetary policies, Emerging Market demand for commodities appears insatiable and markets like to discount forward rather then stare at the present. However, there are two major assumptions an investor has to make in order to justify current pricing. First, assuming 2010’s price of $1420 remains level, inflation would have to compound at 10% annually for the next fifteen years in order to just get back to equilibrium levels with gold (of course it could compound faster over a shorter period or slightly faster over a longer period). Not saying this is impossi-ble but the US has never sustained this type of continued inflationary pressure since data has been compiled by the Bureau of Labor Statistics. Even through the last bout of serious inflation in the 1970’s, US inflation experienced only three consecutive years of 10% plus annual growth. By no means are we trying to suggest extraordinary high rates of inflation are not possible, however we are suggesting gold bugs have already built in fairly robust inflation assumptions and if expecta-tions fall short there could be significant pain.
Second, the bond market, which is much larger and deeper than gold, is not registering the same long term infla-tion expectations as gold. Expected inflation rates remain anchored between 2% and 3%, so either the gold mar-ket or the bond market has future inflation expectations gauged inaccurately. Given the depth of the market and type of investor in the bond market we feel it should be given the benefit of doubt.
The analysis of CPI versus gold suggests gold should be valued at approximately $400 per ounce. However, if we had to weigh the rationale between valuing gold between mining extraction costs and CPI growth rates we would err towards extraction rates because they more truly reflect actual cost increases related to the production of gold. This would place gold‘s intrinsic value somewhere in the neighborhood of $600 per ounce.
Investment Conclusion-
Our evidence suggests a high probability of structural price weakness for gold in the future. Net supplies are rising quickly in response to higher prices, demand from stickier sources is being replaced by speculative prac-tices and valuation metrics appear stretched. With that being said, speculative conditions certainly can persist and/or future inflation may be considerably higher then historic trends which would likely lead to more buying. However, the desire of this analysis was not to pick the ultimate top in gold but rather suggest that by purchasing gold at these levels an investor is entering into a speculative transaction and not one based on solid investment fundamentals. An investor will be hoping inflation defies long term trends, costs of extraction rise quickly and/or sources of supply dwindle, not to be replaced. With this in mind it would appear logical to tread carefully when entering this market, hedge any current gold exposure or possible seek to monetize what may be increased future levels of actual and/or implied volatility by using volatility arbitrage techniques.
Patrick W. Hejlik, CEO
Fourth Quadrant Asset Management LLC
4115 Blackhawk Plaza Circle, Suite 14
Danville, CA 94506
At Fourth Quadrant Asset Management we take a unique and better approach to managing portfolios. The majority of our clients’ portfolios are invested in a mix of global equities and fixed income but we also incorporate the use of options and volatility instruments to minimize downside risk while maintaining upside potential. This methodology places risk management first and allows clients to capture opportunities many miss providing the greatest opportunity to meet their long term investment goals.
For more research on how to protect your portfolio and get your retirement back on track check out Fourth Quadrant Asset Management
