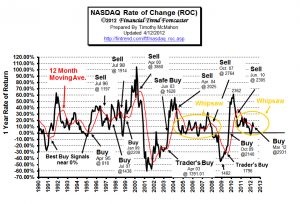
The moving average is a simple tool designed to help you easily determine the underlying financial trend of a stock, bond, commodity, mutual fund, or any other financial instrument. According to Wikipedia a moving average is “commonly used with time series data to smooth out short-term fluctuations and highlight longer-term trends or cycles. The threshold between short-term and long-term depends on the application, and the parameters of the moving average will be set accordingly. For example, it is often used in technical analysis of financial data, like stock prices, returns or trading volumes.”
Moving Average
The moving average is often the first tool that budding forex traders encounter. Put simply, it is the average of an instrument’s price plotted over time. You will almost always find the moving average plotted alongside the price itself on a chart. You may find it useful for determining if the price is in a trend.
The first thing that you’re likely to notice about the price’s relation to the moving average is that it is always either above or below it. At first glance, this may seem incidental. However, you should not overlook it. If the price is above the moving average, then you know immediately that the price has been rising more than falling.
Conversely, if the price is below the moving average, it follows that the price has been falling more than rising. This alone does not tell you whether the price is in a trend, because it has a tendency to run flat at times. Still, you can use this relative position to immediately get a feel for price direction over the last several periods.
When a Moving Average Crosses Over
 The primary signal that technical traders derive from the moving average occurs when the price crosses it from either above or below. If the price crosses the moving average from below (to above), it is thought to be shifting into a bullish, or upward mode. If it crosses from above (to below), it is said to be switching to a bearish or downward mode.
On the surface, this cross may appear to be a simple, elegant trading system. However, a moving average is a “lagging indicator”, and as such, should not be used on its own. As a lagging indicator, the moving average simply reacts to the price’s movements. Keep in mind that it is nothing more than the price’s average plotted over time. For instance, if you load a 10 period moving average on a one hour chart, you are looking at the average price of the last 10 hours.
The line that represents the moving average on the chart does, therefore, literally lag the price by 10 hours. This is why, as you watch it, you will notice that it moves much slower than the price itself. This is precisely why the price weaves above and below the moving average so frequently.
Moving Average- Whipsaw
These movements are, for the most part, random. If you attempt to trade them, you will inevitably run into a phenomenon known as “whipsaw.” Whipsaw occurs when the price closes above or below a moving average, triggering a trade, and then immediately moves in the opposite direction. Such losses quickly add up. Longer time frames are more stable than shorter time frames, so you can minimize the occurrence of whipsaws by trading them. Still, you can never completely avoid whipsaws. You can see, then, that trading on the impetus of the moving averages alone may be a haphazard strategy.
Determine the Long Term Trend
In order to see a more rewarding result from moving averages, you will want to first determine the direction of the long-term trend. To put it in perspective, imagine that you have been taking signals from a 20 period moving average on a 5 minute chart. Every time the price falls below the average, you sell, and every time it rises again, you buy.
Because you are using only one moving average, and because that moving average is rather short, you are exposing yourself to a great deal of potential loss in the form of whipsaws. However, if you simply add a longer moving average to the chart, say a 100 period moving average, you will gain immediate insight into the direction of the trend.
You will then have two moving averages, and you should be able to see that when the shorter moving average is above the longer, the price has been moving consistently higher. The same holds true for the other direction.
It follows then, that when the shorter moving average is above the longer, and is pointing up, that the price is in an uptrend, and vice-versa. You can take advantage of this situation by buying only when you determine that the price is in an uptrend, and it closes above the short-term moving average as well.
For more information see: Investing Using Moving Averages
Also : Elliott Wave International (EWI) has released a free 10-page trading eBook: How You Can Find High-Probability Trading Opportunities Using Moving Averages, by Senior Analyst Jeffrey Kennedy. Download Your Free eBook Here.
About the Author:
Chris Keenan, is a blogger for a new jersey immigration attorney, who writes on a variety of topics from family finances to outsourcing law.
