In today’s article Chris Ciovacco looks at the current battle between Bulls and Bears in the market and what we should watch closely and what we should do about it. Is this just a correction or has the market made a new high? ~Tim McMahon, editor
The market currently has a mixed profile; the bears have control of the daily trend, but the bulls have not given up the weekly trend. The well-documented fears of Fed tapering are undoubtedly a significant factor in the market’s mixed picture. Economic reports, including those released early Monday, have added to the confusion among traders and investors. From Bloomberg:
The Institute for Supply Management’s factory index decreased to 49 in May from the prior month’s 50.7, the Tempe, Arizona-based group’s report showed today. Fifty is the dividing line between growth and contraction. The median forecast of 81 economists surveyed by Bloomberg was 51U.S. construction spending increased 0.4 percent in April, less than the median estimate of 0.9 percent, a government report showed. The S&P 500 declined 1.1 percent last week as investors speculated the Federal Reserve will consider scaling back stimulus efforts as economic data improves.
Bulls vs. Bears: What To Watch This Week
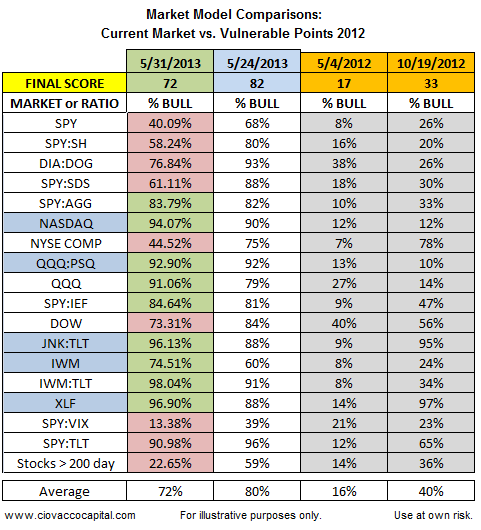
The table below shows a mixed bag from key market sectors and ratios. The concepts are described in the video below the table. The red 40.09% on the S&P 500 (SPY) line in the table tells us the weekly chart weakened between May 24 and May 31. The green 94.07% next to the NASDAQ tells us the weekly chart improved between May 24 and May 31. The table shows weakness creeping into the weekly trends of the S&P 500, longs vs. shorts (SH), and Dow (DIA). The bulls are hanging their hat on the strength that was still evident in tech stocks (QQQ), tech long vs. tech short (PSQ), and credit spreads (JNK) vs. (TLT).
Correction or New Highs?
This week’s technical analysis and stock market forecast video covers areas of the financial markets that hold the key to the market’s next move: technology, small caps, credit spreads, and financials. ETFs covered include IWM, XLF, SPY, JNK, TLT, and VXX.

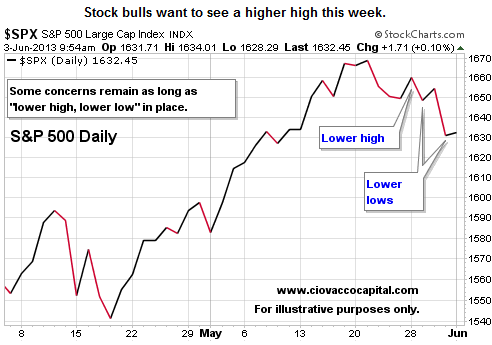
Bears Have Daily Trend
The short-term trend, as measured on a daily chart, has flipped from up to down. A downtrend is defined by a series of lower highs and lower lows, which is what we have on the chart below. The weakness was set in motion by concerns about the Fed cutting back on stimulative bond buying (a.k.a. tapering).
Bulls Still Hold Weekly Upper Hand
The stock bulls counter Fed concerns with the argument that any tapering would be a sign of economic strength. The economic strength case is still ruling the weekly trend, but signs of deterioration are creeping into the picture.
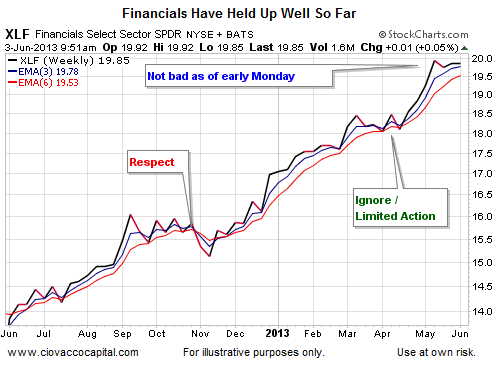
From a probabilistic perspective, there are numerous ways to differentiate between volatility that should be ignored and volatility that should be respected. One method is to use weekly moving averages (red and blue lines below). A “bullish look” is described via the green text below. A “bearish look” is described in red. As long as the market maintains a bullish bias, the volatility is classified as “ignore it”. As of the May 31 close, the volatility still falls in the “ignore it” category. Could the chart below morph into a “respect it” look? Sure it can, but until it does, we will give the bullish trend the benefit of the doubt.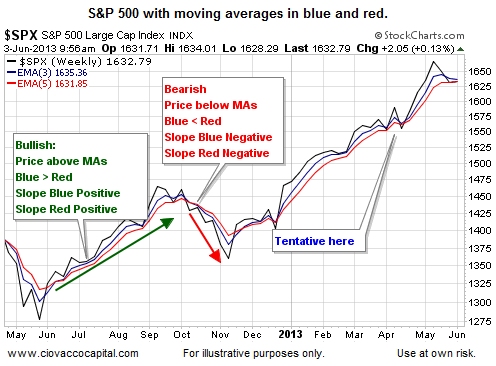
China Adds To Growth Concerns
Investors were greeted with news Monday that China’s factory activity shrank for the first time in seven months in May and growth in the services sector slowed. From Reuters:
The HSBC/Markit Purchasing Managers’ Index (PMI) for May dropped to 49.2, the lowest level since October 2012 and down from 50.4 in April, as domestic and overseas demand fell. The figure was slightly lower than a preliminary reading of 49.6 released on May 23. Fifty divides expansion from contraction compared with the month before.
Weekly Picture Luke Warm
The three graphs shown in this image are emblematic of the market’s indecisive state. The weekly chart of the NYSE Composite below shows the stock market is teetering on the edge of leaving an “ignore the volatility” state and moving into a “respect the volatility” state.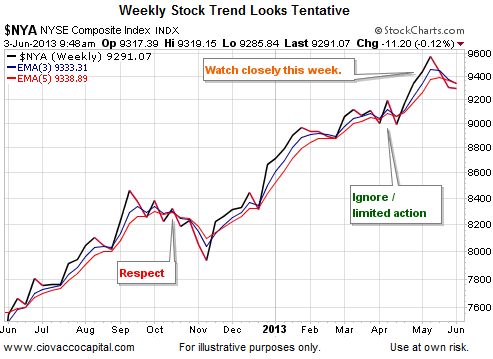
Financials Give Bulls Hope
All things being equal, it tends to be a good sign for the general stock market when financials provide leadership. The weekly chart of financials (XLF) below still has a bullish or “ignore the volatility” look to it.
Investment Implications
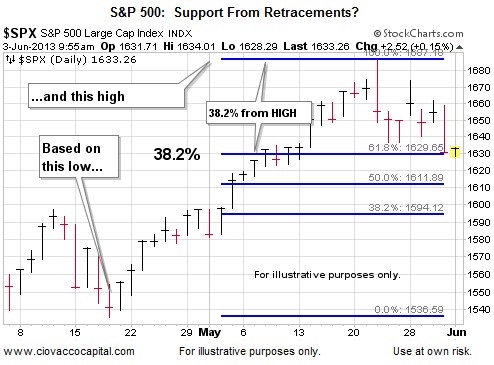
The relative minor deterioration in the market’s risk-reward profile thus far has warranted only a small reduction in risk exposure, which is what we did last week. If the weak charts, such as the weekly NYSE Composite, continue to take on a more bearish profile, we will reduce risk further by raising additional cash. The timing of any further reduction in risk will be impacted by the S&P 500’s action near the Fibonacci levels shown below (1629, 1611, and 1594). Traders watch these levels since they can represent areas where buyers may step in during declines.
 If the market leaders, such as financials, can continue to lead, then some patience is warranted with our stock holdings. We will tread water until the markets tip their hand one way or another. The indecisive state of the markets tells us this is an important week for both bulls and bears.
This article was originally published by Chris Ciovacco under the title Economic & Fed Confusion Reign In Markets and has been reprinted by permission.