Market’s Message Prior To The Election
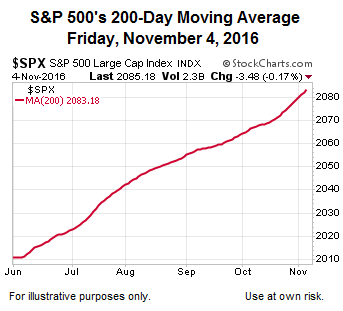
While there is no question the stock market’s short-term profile was showing signs of strain before voters headed to the polls, an analysis performed six trading days before the election noted the stock market’s long-term outlook remained constructive:
The slope of the 200-day looks quite a bit better than it did before the 2016 New Year’s plunge, telling us the present day long-term outlook is quite a bit better than it was on January 1, 2016.

Market Expectations Shift After Election
In the first three trading days after the election, the market seemed to align with the basic narrative from A Wealth Of Common Sense:
The recession/crash scenario is certainly one to consider. But here’s one scenario not many people will be talking about — it’s possible that within the next couple of years we could see a melt-up in the markets.
No one really knows what Trump’s policies will be (possibly not even him yet) but he has stated numerous times that he plans on doing massive infrastructure spending. He’s always promised tax cuts and isn’t afraid of large budget deficits. If anything like this were to happen, we could see much higher corporate profits and higher inflation.
If this were to occur I think it’s possible that we could see a massive shift in investor allocation preferences which could potentially take the stock market into bubble territory.
Impressive Election Follow-Through?
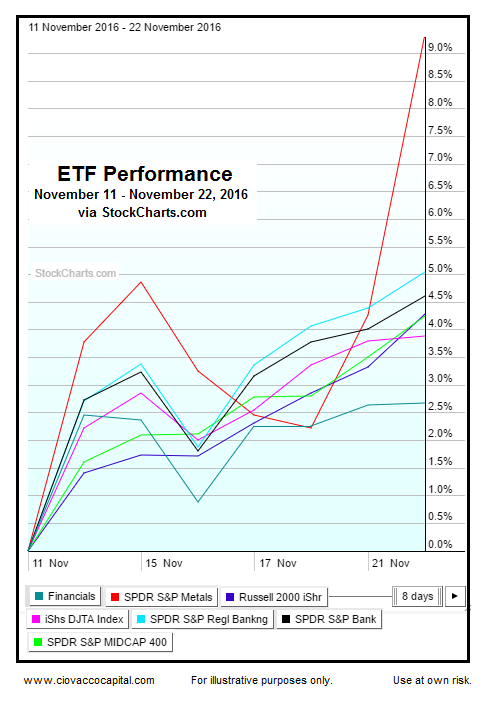
A November 11 analysis highlighted numerous asset classes and sectors, including base metals, transportation, banks, and smaller-capitalization stocks, that could benefit from Trump’s anticipated policies. Did the market continue to respond to the Trump platform after the November 11 analysis? The answer is yes; the chart below, via stockcharts.com, shows the performance since November 11 for metals (XME), regional banks (KRE), transportation (IYT), mid-caps (MDY), and small caps (IWM).

How Does The Big Picture Look Now?
This week’s stock market video compares and contrasts asset class behavior before and after the election in the context of the pre-and-post election fundamental drivers. The analysis also walks through the evolution of the market’s risk-reward profile between February 2016 and the present day, allowing us to put the market’s current profile in some historical risk-reward perspective.


Fed Rate Hike Baked In
Given the market has placed roughly a 94% probability on the Fed raising rates in December, it is unlikely a rate hike is going to catch many market participants by surprise. From Bloomberg:
“Analysts spent early November warning a Trump victory in the U.S. presidential election would make the Federal Reserve less likely to raise interest rates. What happened instead is that it made a December increase a near certainty.”
“Traders assign about a 94 percent probability, the highest level this year, to a Fed boost at its final meeting for the year on Dec. 13-14, futures contracts indicate. Trump’s spending plans, and Republican control of Congress, are causing the market to revise higher its outlook for the pace of Fed rate increases.”
You might also like:
- Big Picture Update Commodities and Precious Metals
- Profiting from Rising Interest Rates
- FED cuts Rates What will the Market Do?
- ETFs What You’re Really Buying
This article by Chris Ciovacco originally appeared here and was reprinted by permission.
Copyright © 2016 Ciovacco Capital Management, LLC. All Rights Reserved. Chris Ciovacco is the Chief Investment Officer for Ciovacco Capital Management, LLC (CCM). Terms of Use. This article contains the current opinions of the author but not necessarily those of CCM. The opinions are subject to change without notice. This article is distributed for informational purposes only and should not be considered as investment advice or a recommendation of any particular security, strategy or investment product.
