 At the Federal Reserve’s recent policy meeting on Wednesday, December 14th the FED raised their federal-funds target interest rate by a quarter percentage point, to range between 0.50% and 0.75%. Fed officials pointed to a strengthening economy and inflation nearing their targeted level of 2%.
According to the The Wall Stree Journal “The Fed’s more aggressive tone about rates took steam out of a stock-market rally that has been pinned to hopes for faster growth spurred by the incoming Trump administration’s plans to cut taxes, boost spending and cut regulations.”
However, the market had already been expecting the rate increase so it was already “baked into the cake” so the only shock to the market would have been if they didn’t raise rates. The NYSE opened Wednesday at 11,214 and by the close, it had lost just over 100 points bringing it down to 11,098. On Thursday it opened a little lower at 11,087 and regained a bit of its losses by closing at 11,131. By Friday it opened at 11,152 and then took a bit of a breather for the weekend by closing at 11,125. To me, this doesn’t look like the major correction that theWSJ implied would happen. It looks more like the average breather the market takes on occasion to digest news.
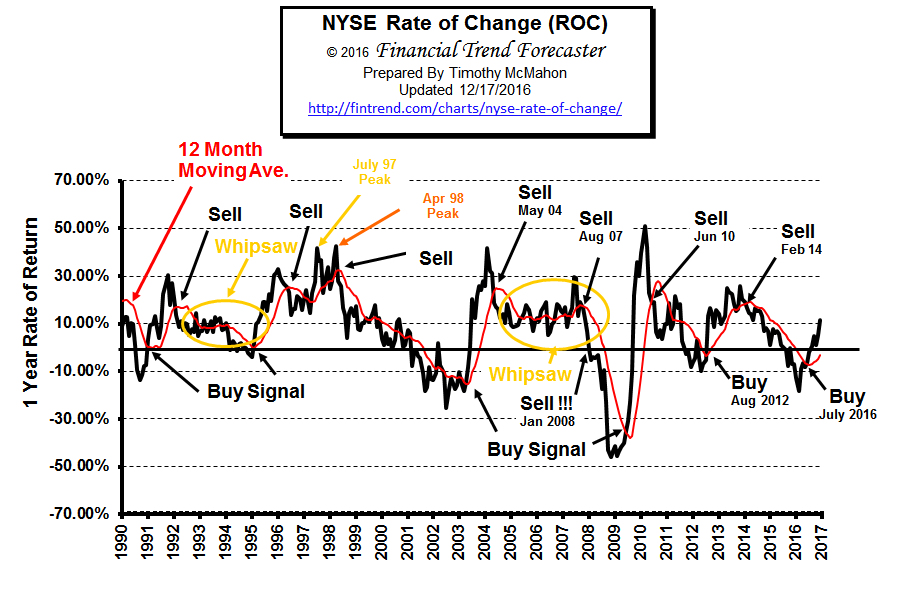 Our NYSE Rate of Change (ROC) chart still has a buy signal. In this month’s commentary we said, “Prior to the election the media was all saying that the market had figured in a “Hillary Win” and they predicted that if Trump won… the market would take a major dive. However, just prior to the election, the annual rate of return was only 1.10%, so the market actually wasn’t so optimistic about a Hillary win. And, in the month since the election, the NYSE has tacked on over 4%, bringing the annual rate of return to 11.4%! So, not only did the media get the election prediction wrong, they also misjudged the market’s reaction to a Trump win. So this month the ROC and its moving average are both rising. The ROC is still well above its moving average.”
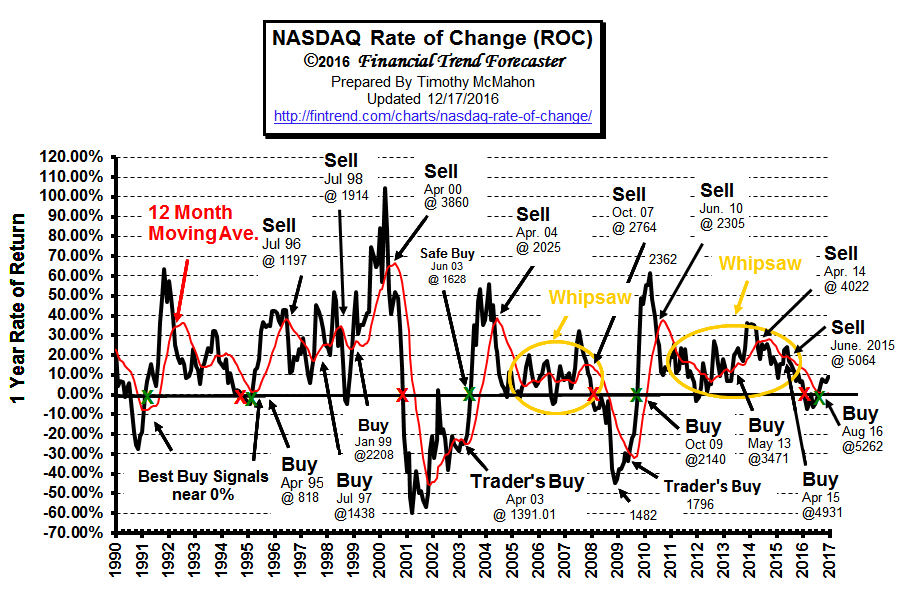 The NASDAQ Rate of Change Chart also retains its buy signal. The NASDAQ index increased 2.69% since last month and remains above its moving average which is currently well above the zero line. Thus maintaining a buy signal. Annual return has increased from 6.22% last month to 9.79% since the election. The NASDAQ market opened Wednesday at 5467 and closed at 5436. Thus losing roughly ½% on the day. Interestingly, Friday opened at 5467 (roughly where Wednesday opened) and closed at 5437 (roughly where Wednesday closed).
A year ago, on December 16, 2015 the FED embarked on America’s first interest rate hike in nearly a decade. The Federal Reserve raised its key interest rate from a range of 0% to 0.25% to a range of 0.25% to 0.5%. That time the reaction was quite different. On the Wednesday of the announcement the NASDAQ opened at 5033 and it closed at 5071. So the initial response was actually positive (the market went up ¾%). But the next day reality set in and the market fell from 5087 to 5002. And the following day it fell again from 4982 to 4923. For a net loss of 110 points or 2.1% from Wednesday open to Friday close of announcement week. Then by the end of February the Nasdaq was around 4600.
 This year basically nothing happened… the Nasdaq went from 5465 to 5437 or a net loss of about ½% from Wednesday open to Friday close of announcement week. Only time will tell where the market goes from her but my feeling is that it has turned the corner and will continue upward.
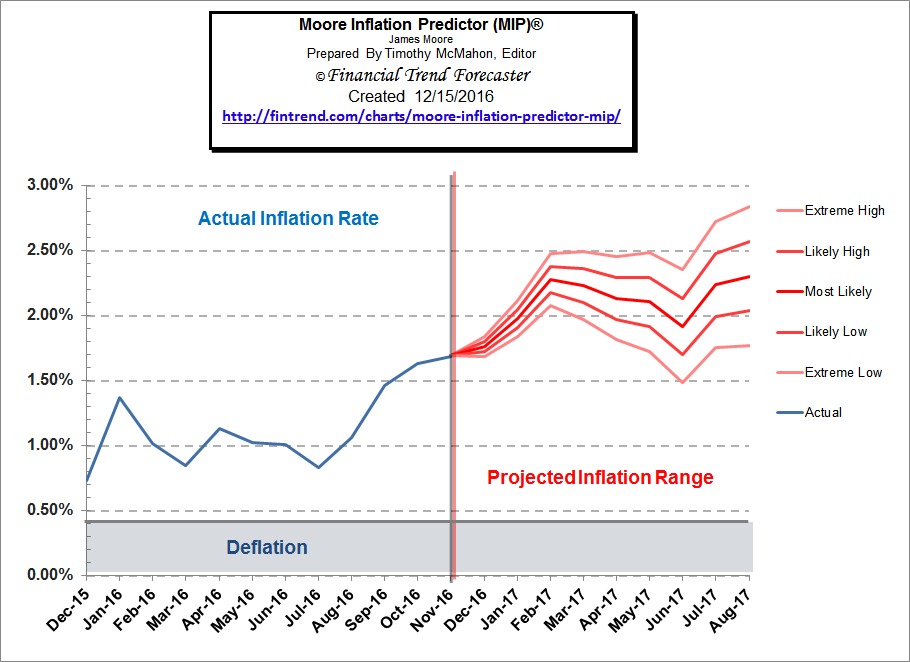
Our Moore Inflation Predictor (MIP) is projecting moderately higher interest rates but perhaps the FED rate hike will take some wind out of inflation’s sails as well.