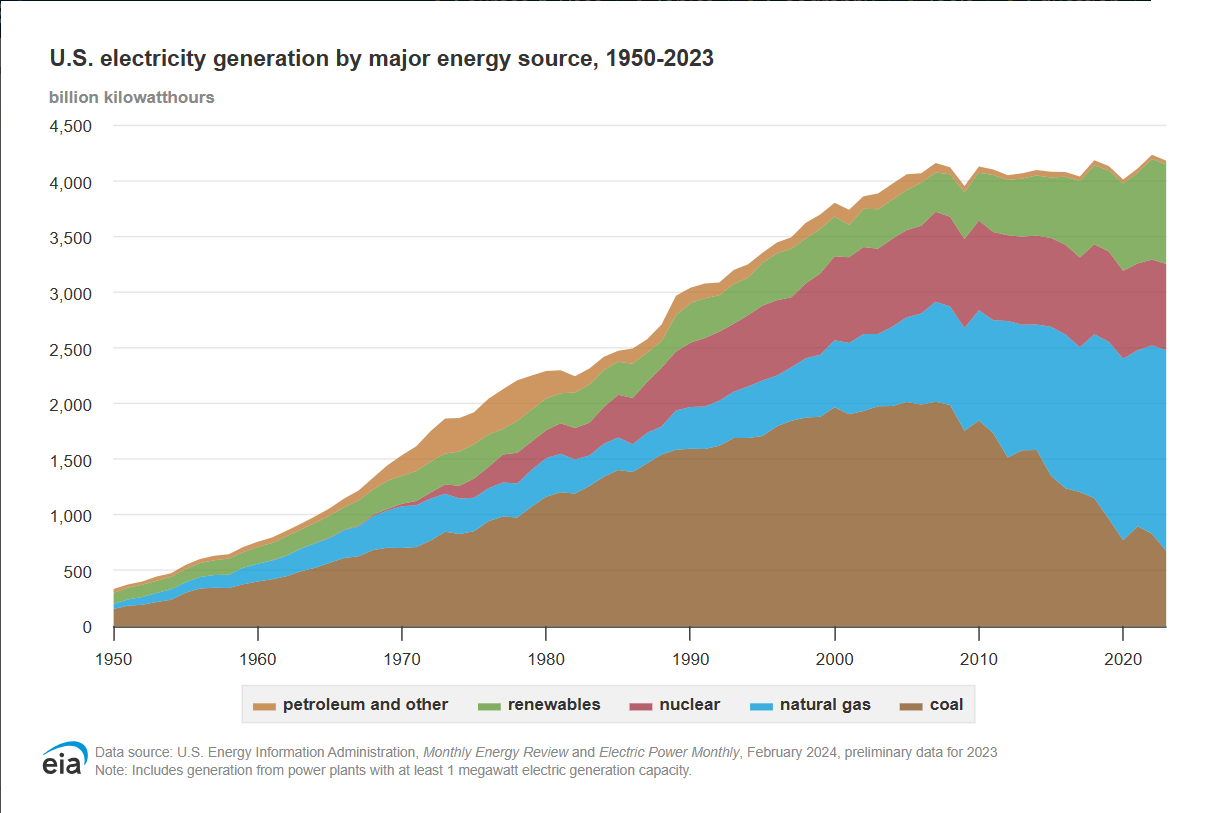
We all know that Artificial Intelligence (AI) uses a lot of electricity, and the most recent fear is that AI is going to suck up all the electricity, and households will be stuck with “rolling blackouts”. The following chart, created by the U.S. Energy Information Administration (USEIA) has been used to illustrate how energy capacity has been roughly flat for the last decade.
 Source: EIA
EXCEPT there is a major problem with that conclusion, and a close reading reveals that this chart doesn’t show generation capacity, but rather how much electricity was actually generated (and the source of that electricity). In other words, it shows how much electricity was used not how much could be generated.
What we can see from this chart, is that coal-generated electricity has drastically decreased over the last decade, and natural gas and, to a lesser extent, renewables have taken up the slack, but this chart tells us absolutely nothing about total capacity.
We might assume that, since utilization has been flat, capacity is maxed out, and that is why utilization has been flat. But without more information, that is simply an assumption, nothing more.
Factors Affecting Capacity:
Not all “capacity” is equal. There are factors that affect the usability of the various types of electricity generation. The most obvious one is Solar and Wind. Solar-generated electricity is only available when the sun is shining, and wind power is only available when the wind is blowing. The EIA estimates something called a “capacity factor” for each of the fuel types.
“Capacity factor” is a measure of how often a power plant runs at its maximum possible output over a specific period of time. It’s expressed as a percentage:
According to the EIA:
| Capacity Factor by Fuel Type | ||
| Fuel Type | Capacity Factor (%) | Notes |
| Wind & Solar | ~25–35?% | Intermittent nature caps utilization |
| Hydroelectric | ~35–44?% | Varies with water availability |
| Natural Gas | ~38?% | Mix of baseload and peaking; flexible dispatch lowers utilization |
| Coal | ~50?% | Baseload, but declining due to retirements |
| Nuclear | ~90–93?% | Consistently high—operates as baseload |
So, even though they only have a 25-35% capacity factor, Wind and Solar are pretty much at full capacity because they produce when they produce, and you can’t make the sun shine or the wind blow any more than they do. And at the other end of the spectrum, you have Nuclear, which pretty much has to produce constantly because you can’t just shut it down and restart it whenever you feel like it.
So, what can be “ramped up” if we needed more electricity?
Hydroelectric is much like Wind and Solar because it is based on the availability of water, so you can’t get much more hydro. Coal is being phased out due to environmental considerations, so that leaves Natural Gas. Gas-fired electrical plants are relatively easy to increase or decrease production, so they are used on an “as needed” basis. Thus, electricity production from natural gas can easily be ramped up, and electricity from coal can be increased only with legislative changes (some of which Trump has implemented for a temporary solution).
Capacity Utilization
In the following chart, we are going to look at “Capacity Utilization,” which differs from the above-mentioned “Capacity factor”. The Federal Reserve Board constructs estimates of capacity and capacity utilization for electric and gas utilities. The capacity utilization rate is equal to an output index (seasonally adjusted) divided by a capacity index. The Federal Reserve Board’s capacity indexes attempt to capture the concept of sustainable maximum output, i.e., the greatest level of output a plant can maintain within the framework of a realistic work schedule, after factoring in normal downtime and assuming sufficient availability of inputs (i.e., fuel) to operate the facility.
According to the Federal Reserve:
Historical Capacity Utilization
For the last 25 years, we have consistently been using less and less of the total capacity. As of June 2025, Capacity Utilization is down to 69.78%, i.e., just under 70%. In contrast, in the late 1960s and the late 1990s/2000, utilization was at nearly 100%. I personally remember rolling brownouts in the 1970s (along with catastrophic blackouts). The 1977 NY City blackout was the result of lightning strikes, which tripped breakers at two sub-stations and the nuclear plant at Indian Point. Because everything was running at capacity, it cascaded to overloading more and more transmission lines, eventually shutting down the NYC area. Looting and vandalism were widespread in New York City, hitting 31 neighborhoods.
One subsequent method implemented to increase electricity production and reduce the possibility of blackouts on Long Island was the building of “mini-turbines”, i.e., turbines under the 80 MW threshold that would trigger a full regulatory and environmental review. These gas-fired turbines can be quickly started to absorb peak loads. There are currently estimated to be 21-24 mini-turbines able to be deployed on Long Island alone.
So, we can see that when “Capacity Utilization” approaches 100% we end up with brownouts, blackouts, and other problems.
What Are our Current Problems?
So, if capacity isn’t the problem, why are AI proponents worried about getting enough electricity?
In many areas, electric grids are already strained:
- Aging infrastructure in parts of the U.S. and Europe limits expansion.
- Slow permitting delays new grid connections for data centers.
- Intermittent renewables (like solar and wind) don’t always align with AI’s consistent 24/7 power needs.
- Even if enough capacity exists, getting that power to the right location is a major logistical and regulatory hurdle.
- Power production vs. Consumption mismatch.
Electricity, like all commodities, needs to be transported from where it is produced to where it is consumed. If the transmission lines aren’t up to the load, there can be problems. Also, the further away the production is from the consumption, the greater the line losses, so large consumers like AI, Crypto mining, Data Centers, EV charging networks, semiconductor fabs, and even traditional manufacturers prefer to locate near electric production. But consumers don’t like power plants located near them.
Mismatch Between Production and Load
- In the U.S., AI-related power demand could double by 2030, possibly consuming 4–6% of total U.S. electricity.
- Big tech companies (like Microsoft, Google, Amazon) are rapidly building massive “hyperscale” data centers.
- Each new center can require 50–100 megawatts or more, enough to power tens of thousands of homes.
- AI loads are constant, while renewables are variable.
- Batteries help, but aren’t yet scalable enough to meet multi-gigawatt, always-on AI demand.
- Some companies are turning to natural gas as a fallback, risking higher emissions and climate policy conflicts.
Large Consumer’s Response
- Buying or building power plants: Microsoft and Elon Musk have reportedly considered (or are already) doing this. (xAI, Musk’s AI startup, deployed portable, mini-turbines to temporarily power its “Colossus” supercomputer in Memphis until local grid delivery could meet demand. (Just as Long Island did.)
- Long-term energy contracts: Securing decades-long electricity deals to lock in access and price.
- Investing in nuclear, geothermal, and advanced energy storage to provide steady, clean baseload power.
- Locating data centers near cheap power: Rural areas with excess capacity are becoming hotspots (e.g., parts of Iowa, Wyoming, and Québec).
California Blackouts, Brownouts, and Other Outages
So, if the U.S. is only using 70% of its capacity, why does California suffer from outages? There are other factors causing California’s problems. Their focus on renewable power means that they need significant amounts of battery backup storage for times when there is no wind or solar. Sometimes there are storage problems (like fires). But they also suffer from a complex mesh of aging infrastructure, extreme weather, and evolving utility policies. Sometimes, they purposely shut off power during hot, dry days with sustained winds or strong gusts to prevent power lines from sparking wildfires. During 2019, California experienced 25,281 “blackout events” affecting 28.4 million people. From October 2017 through October 2019, there were 2,374 Public Safety Power Shutoffs (PSPSs). You might think that since they were done on purpose that they would be brief in duration,n but that isn’t the case. On average, they lasted 47 hours (i.e., almost 2 days each).
Conclusion:
The energy situation is complex, and demand is growing, but the problem isn’t necessarily just production capacity, but rather distribution, aging infrastructure, regulatory red tape, and the time necessary to build out infrastructure.
You might also like:
- Will AI And Bitcoin Mining Balance Or Destroy the Grid?
- Breaking Free from China’s Rare Earth Monopoly
- The Potentially Devastating Differences Between CBDCs and Stablecoins
- Can “Enhanced Geothermal” Overcome AI’s Mammoth Appetite For Electricity?
- California’s Latest Hustle: Utility Bills Based on Ratepayers’ Income
- The European Energy Crisis May Be Back Soon
- Batteries: New Sea-Water Based Battery to Replace Lithium
- The Future of U.S. Energy Independence