Elliott Wave International

Elliott Wave International (EWI) is the world’s largest market forecasting firm. EWI’s 20-plus analysts provide around-the-clock forecasts of every major market in the world via the internet and proprietary web systems like Reuters and Bloomberg. EWI’s educational services include conferences, workshops, webinars, DVDs, streaming videos, special reports, books and one of the internet’s richest free content programs, Club EWI.

McClellan Summation Index

Why These Stock Market Indicators Should Grab Your Full Attention

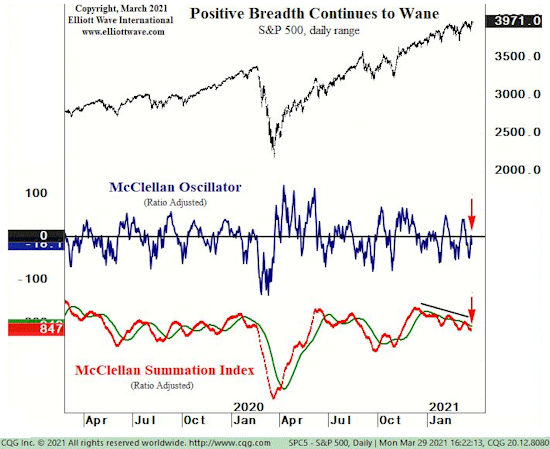
What is the McClellan Index and why should you care? According to Investopedia, “The McClellan Summation Index is a long-term version of the McClellan Oscillator, which is a market breadth indicator based on stock advances and declines. The McClellan Summation Index is used in technical analysis and can be used to identify bullish or bearish bias, as well as the strength of the trend. It is a different way of quantifying the movements in the market other than looking at the price levels of the different indices.”

Why These Stock Market Indicators Should Grab Your Full Attention Read More »

Stocks Up Rates Up

Do the FED’s Interest Rates Affect the Stock Market?

In anticipation of the September 25-26 Fed meeting, CNBC ran this headline (Sept. 21): “Record High Stocks Face Fed Rate Hike.” implying that the Fed’s interest rate decisions actually affect the stock market. Common wisdom says that “falling interest rates means higher stock prices, while rising interest rates means lower stock prices.” At first blush this might sound logical because rising interest rates makes fixed income investments more attractive because they pay more and have less risk than stocks. So some of the available capital will flow into bonds, etc. thus starving the stock market and putting downward pressure on prices.  In this article, Elliott Wave International contends that there is actually no consistent relationship between interest rates and the stock market and they present examples of how the exact opposite of what you would expect has happened.

Do the FED’s Interest Rates Affect the Stock Market? Read More »

What Can We Learn About the Stock Market From the NY Subway?

New York city is one of the most populous cities in the world and of course the home of the massive New York Stock exchange. The New York City Subway is the largest rapid transit system in the world by number of stations, with 472 stations in operation. The system is also one of the world’s longest. Overall, the system contains 236 miles (380 km) of routes, translating into 665 miles (1,070 km) of revenue track; and a total of 850 miles (1,370 km) including non-revenue trackage. But what is truly interesting is how the development of the NYC subway parallels the New York Stock market.

What Can We Learn About the Stock Market From the NY Subway? Read More »

Pension Exit

Why Nervous Pensioners Are Running for the Exit

The public pension system is like a ship headed for rocky shores and the problem was created by the FED. In trying to resolve one problem the FED has created another. By keeping interest rates artificially low the FED has boosted the stock market unnaturally high while at the same time forcing Public Pension Funds to pursue high-risk policies in an effort to fund their liabilities to their constituents. This has created a Catch 22 sort of situation that will not end well. The following video by Elliot Wave International explains the situation.

Why Nervous Pensioners Are Running for the Exit Read More »

Why Europe is Going to Get a Lot Worse Before It Gets Better

Here’s what you will learn:

How Europe’s biggest economies are screeching to a halt
Currency devaluation’s role in the developing global crisis
How the self-reinforcing aspect of deflation is already apparent in commodities trading
Why the top 1% of earners are in for a rude awakening
The hair-raising future for U.S. stocks

Why Europe is Going to Get a Lot Worse Before It Gets Better Read More »

Why Investors Cling to Hope Amid Stock Market Turmoil

History suggests that investors cling to hope all the way down. As this chart of the average holding period for a NYSE stock illustrates, investors actually turn up the hope and cling most tenaciously to their shares in bear markets. In bull markets they may espouse the buy and hold approach, but the chart shows that they don’t actually practice what they preach.

Why Investors Cling to Hope Amid Stock Market Turmoil Read More »

Why the IRS Seized All the Money from a Country Store

Last July, a swarm of officers from North Carolina’s Alcohol and Law Enforcement, the local police and the FBI descended on McLellan’s place of business.

The agents told the small business owner something that shook him to his core: The Internal Revenue Service had seized all of the money in L&M’s bank account: $107,702.66.

“‘Are you telling me you took my money?'” McLellan recalled asking the agents. “I didn’t understand what was going on. They dropped a bomb on me. I was lost for five to 10 minutes. I can’t believe that y’all guys can walk in here and tell me y’all took every bit of my money out of the bank.”

Why the IRS Seized All the Money from a Country Store Read More »

A GREAT Model to Understand Gold’s Price Swings

Are Gold’s price swings as truly unpredictable as Bernanke, Yellen and Greenspan would have you believe? Is gold really a Barbarous relic with no place in a modern portfolio? Or is gold a valid insurance policy against the Fed’s $4 trillion balance sheet which is just a “pile of tinder, but hasn’t been lit”? In today’s article we are going to look at a model that predicted the recent peak in gold and current drop.

A GREAT Model to Understand Gold’s Price Swings Read More »

Scroll to Top