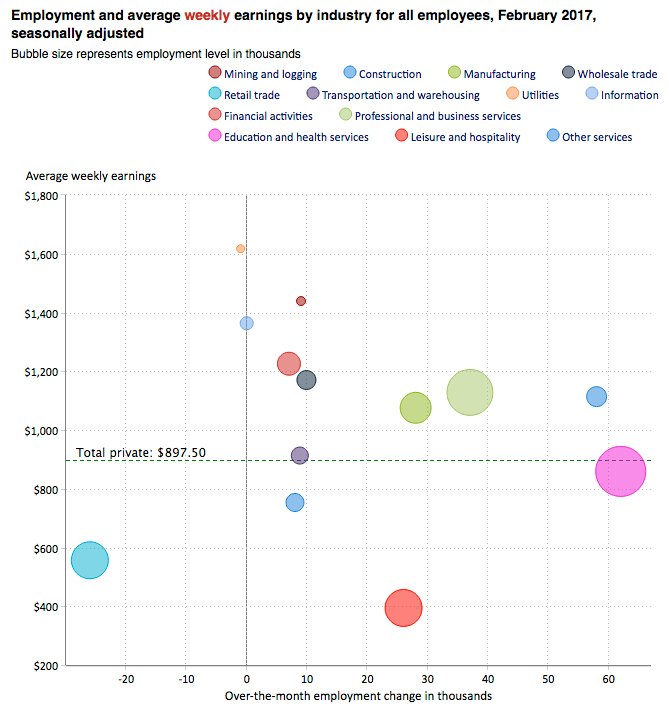
In today’s post Gary Tanashian looks at ten charts and indicators to give us a unique look at the trends of the overall economic situation, the state of the “economic recovery” and the employment situation. He looks at where the jobs are, how the average consumer is doing and even the debt to GDP ratio. I think you will find some real gems in his charts.
This week’s Notes From the Rabbit Hole included a little Payrolls/Wages related economic discussion before moving on to the usual coverage of stock markets, commodities, precious metals, bonds, currencies and related indicators and market internals. With FOMC on tap there will be more data noise directly ahead, but then I expect markets to smooth out into what is looking like a sensible short and intermediate-term plan.

