In the following article, Chris Ciovacco of Ciovacco Capital Management looks at the current market volatility compared to similar occurrences in past years to determine how much risk is in the market today. ~Tim McMahon, editor
Price Action Year-to-Date:- What Can We Learn from History?
Reference Points Provide Context
A December 2016 post highlighted similarities between late 2016/early 2017 and the 1994-1995 period. The analogy proved useful in 2017 with stocks posting a rare low-volatility year that featured a strong bullish trend, which compared very favorably with the strong-gains/low-volatility year of 1995.
Easier Markets and Harder Markets
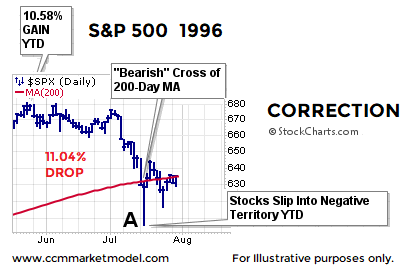
Since we know easier markets are typically followed by harder markets, it is not particularly surprising 1996 was not as easy as 1995. Nor is it particularly surprising 2018 has been harder than 2017. Price action in 1996 featured several bullet points investors in 2018 should easily identify with:
- 1996 started with a gain of 10.58%
- Stocks then dropped 11.04% and went into negative territory YTD
- The S&P 500 dropped below an upward-sloping 200-day moving average.
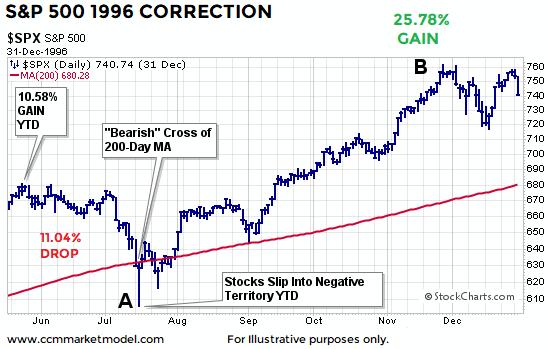
What Happened Next?
After dropping below the 200-day moving average and pushing into negative territory YTD, the S&P 500 resumed its primary trend by tacking on a gain of 25.78%. After a rough period in the first half of the year, patient investors were rewarded with a satisfying annual gain of 20.26%.
How Can it Help Us in 2018?
This knowledge helps us keep an open mind about all outcomes in 2018, including better than expected outcomes. Just as 2017 followed its own path while sharing some key characteristics with 1995, it is within the realm of possibility 2018 could feature a “harder market” in the first few months of the year and still go on to post satisfying gains when the calendar hits December 31, 2018.
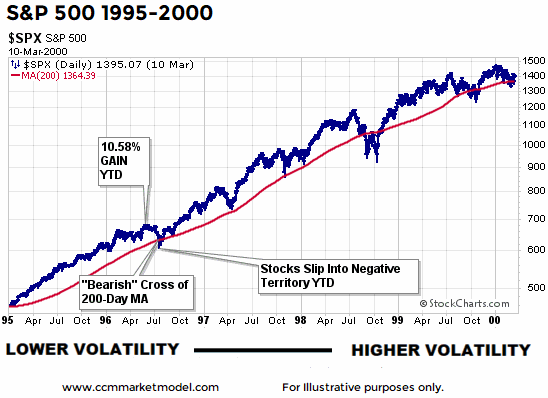
Low Volatility is Not Bearish
When volatility was low in 2017 we heard “this is not normal and is thus bearish”. In 2018 we are hearing “this is too much volatility and is thus bearish”. As calendar year 1995 proves, a low-volatility year, like 2017, is not necessarily bearish. In fact, low volatility is a sign of strong bullish conviction. When we view the increase in volatility that took place between 1995 and 1996, the shift between 2017 and 2018 does not seem particularly abnormal; in fact, it seems to fit the strong-bullish-trend script. We covered these “don’t be surprised if volatility picks up” concepts back on January 29, 2018.
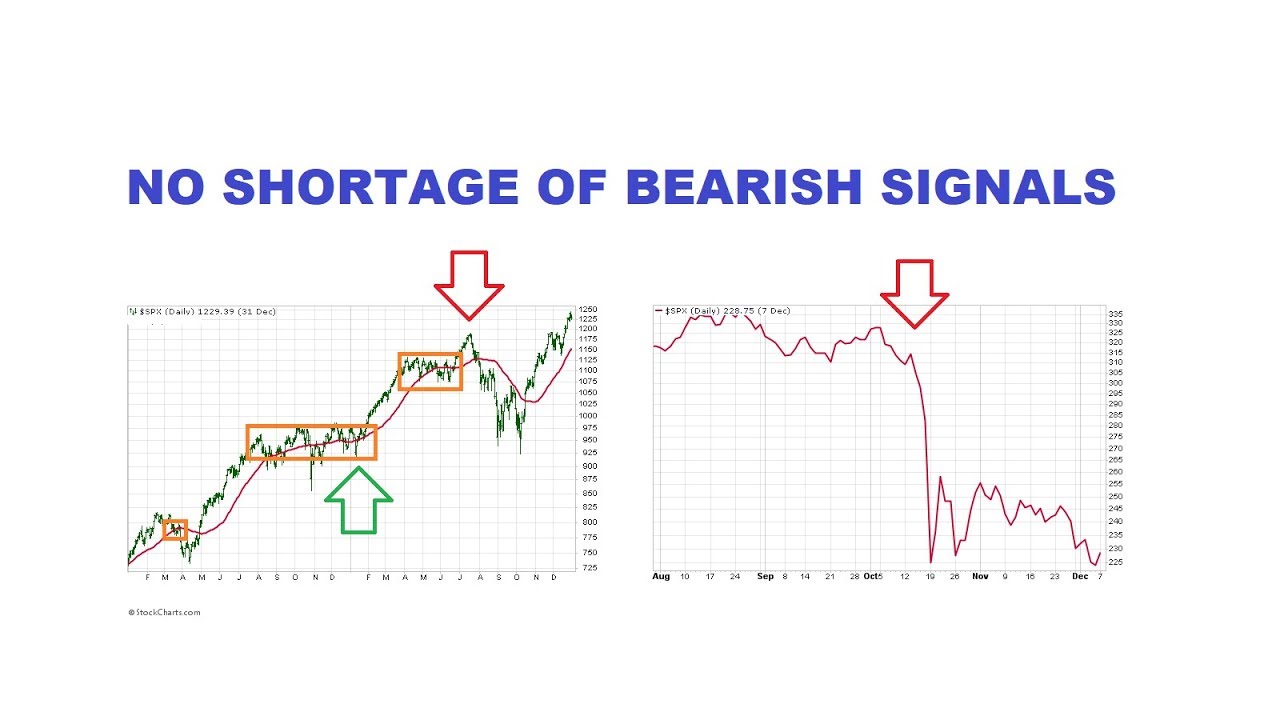
How Often Do Stocks Violate a 50-Day MA? …. a 100-Day MA? …a 200-Day MA?
If you have a pulse, you have probably noticed bearish articles covering “major trendline breaks” involving numerous “key” technical levels, including the 50, 100, and 200-day moving averages. To put these “bearish” signals into some real-world context, this week’s video reviews the frequency of “trendline breaks” within the context of a primary bullish trend. After reviewing the facts, you can make your own call.
Bears Have an Open Door
Given the vast majority of industry-related articles have leaned bearish in recent weeks, it is fairly easy to keep an open mind about an ongoing correction and/or bear market. As outlined on April 2, a sustained S&P 500 visit below 2,532 would give the bearish case a nice boost. It is important under our approach to remain highly flexible and open to all outcomes from wildly bullish to wildly bearish. The markets will guide us if we are willing to listen.
This article originally appeared here and has been reprinted by permission.
You might also like:
- A Correction or a New Bear Market?
- Oil Market Fears: War, Default And Nuclear Weapons
- Tariffs May Not Slow Profit Momentum
- Was the 1,175 Point Drop in the DOW Unpredictable?