Cisco Systems Inc (NASDAQ: CSCO) is on the ascendancy, following a brief correction heading into March 2021. The stock topped out at $49 in February, before dropping towards the $44 – $45 range. Since then, Cisco stock has been characterized by upside momentum, hovering around the $51 – $52 price level. The left-to-right price movement is decidedly bullish, from a November 2020 low of around $35 to its current price level.
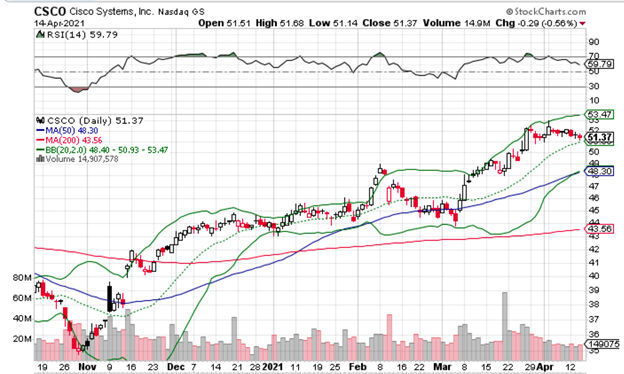 Source: StockCharts Cisco Systems, Inc (NASDAQ: CSCO)
Interestingly enough, the upward shift in prices is far more pronounced than the 200-day moving average of $43.56 and the 50-day moving average of $48.30 indicate. This tends to suggest that there have been dramatic price increases in double-quick time. These price jolts took place at key intervals, in early February, early March, and late March as indicated by the chart above.
The charts further highlight that sharp price increases were followed by downside corrections. However, there were higher highs and higher lows. This industry-leading stock has a market capitalization of $216.873 billion, with a price/earnings ratio of 21.49, and earnings per share of $2.39.
Analysts regard it as short-term and mid-term bearish, but long-term bullish. This provides a degree of direction vis-a-vis price movements. As one of the best stocks to buy in April, Cisco Systems, Inc certainly warrants careful consideration.
CSCO Technical Indicators: Bollinger Bands and MACD
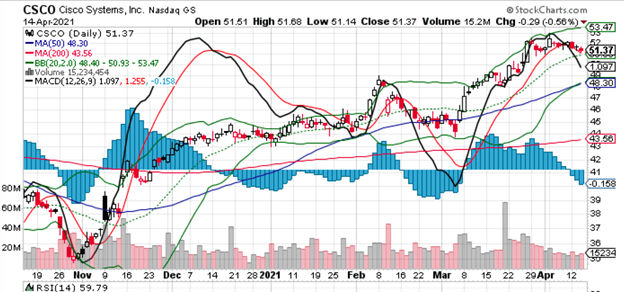
Source: StockCharts Cisco Systems, Inc
The Bollinger Bands suggest that Cisco stock is priced correctly, since the center Bollinger Band is at $50.93, and the spot price of CSCO is $51.37 (April 14). The upper Bollinger Band – the price ceiling – is a key level at $53.47. If this level is breached, it would be indicative of overbought sentiment, with expectations of a downside correction. On the flip side, the lower Bollinger Band is priced at $48.40, and any movement beneath that key level indicates oversold sentiment, with an expectation of a bounce.
Moving Average Convergence Divergence (MACD) parameters at 12, 26, 9, reveal the interrelatedness between the moving averages of a security’s price. These are calculated by subtracting the 26-day EMA (Exponential Moving Average) from the 12-day EMA. If the short-term EMA line is greater than the long-term EMA line, the MACD shows a positive movement as indicated by a rising set of bar charts.
If the 12-day EMA is less than the 26-day EMA, this is represented by a negative set of bar charts. The momentum is strongest with MACD when there are sudden price movements, and weakest when prices are stable. Recent trends for CSCO in April reflect a slowing of price appreciation, in contrast to what happened throughout March. With MACD reversals, traders quickly learn how to enter or exit trades in anticipation of price movements. This allows traders to make the right calls.
Relative Strength Index (RSI)
The RSI (Relative Strength Index) is purely for the purposes of identifying overbought or oversold markets. This momentum indicator has a reading of 0 – 100. Any reading of 70+ indicates that the underlying asset is overbought. With CSCO, the current reading (April 14, 2021) is 59.79, approaching overbought territory. It actually rose above 70 in late March, and retraced to its current levels since then. A reading below 30 indicates the opposite; the stock is oversold, and that will result in a movement to the upside, as indicated by the chart above.
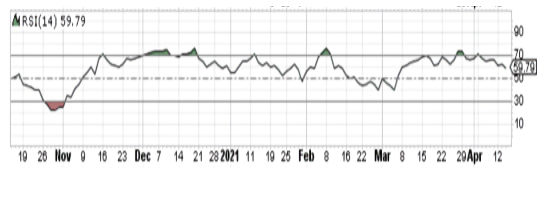
Source: StockCharts Cisco Systems, Inc (NASDAQ: CSCO)
Is Cisco Anticipating a Breakout?
Current sentiment around Cisco is decidedly bullish. This network communications enterprise had been consolidating for the better part of 10 years. Cisco was an integral component of network infrastructure in the early days of the web. Q2 fiscal earnings in 2021 were released in February. The company reported an EPS of $0.79, better than estimates of $0.75. However, revenues dipped 0.4% year-on-year, at a value of $11.96 billion. This was significantly higher than analyst expectations of $11.90 billion.
Preliminary guidance for Q3 2021 is flat, in a range of $0.80 – $0.82, versus the consensus analyst estimate of $0.81. Cisco has raised guidance on revenues in the region of $12.40 billion – $12.64 billion, higher than analyst estimates of $12.32 billion. Cisco is banking on 4 pillars of strength, including… 5G rollout, Internet infrastructure, reopening, and a value proposition.
Further, on a ratings scale of 1 (strong buy) to 5 (sell), CSCO is ranked at 2.3. This is a clear buy proposition. It was recently upgraded in March by Goldman Sachs from a neutral to a buy – a significant indicator for traders sitting on the fence. In fact, the last 3 major upgrades were positive, including those by JP Morgan and DZ Bank. It is against this backdrop that traders are seriously considering the upside potential of CSCO stock.
You might also like: