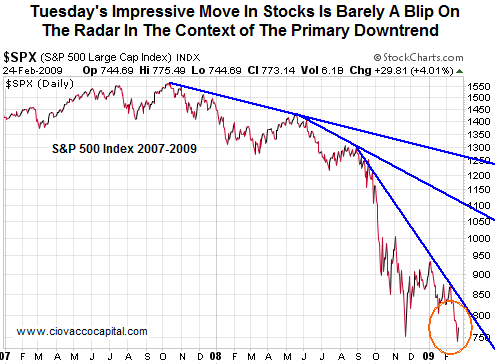
Trends can help us understand the collective perceptions of investors, which ultimately drive asset prices (see charts below).
Fundamental Changes Not Behind Tuesday’s Rally: What appeared to have sparked yesterday’s rally?
- Ben Bernanke on Economy: "If actions taken by the administration, the Congress and the Federal Reserve are successful in restoring some measure of financial stability -- and only if that is the case, in my view -- there is a reasonable prospect that the current recession will end in 2009".
- Bernanke on Banks: "We don’t need majority ownership to work with the banks." This appears to mean we will have slow and partial nationalization of the banks instead of "full" nationalization. Either way, it dilutes the current stockholders and means the U.S. government, either directly or indirectly, will have major influence and power over the banking system. Based on the government's track record of running anything (e.g., Medicare, Social Security, Federal budget, Fannie Mae, the Fed, etc.), it is difficult to see these devlopments as a positive for the economy, free markets, or investors. The government has been "assisting" banks for roughly a year now. Has it really helped? So far the bailouts are reminiscent of "zombie banks" and Japan’s "lost decade". How long will the government be in the banking business? Our guess is a lot longer than most people think.
- Valuations: Lower valuations do not guarantee a market bottom as pure value investors have found numerous times over the last year. If we use very reasonable normalized earnings and PE multiples found at the 1974-1975 bear market bottom, the S&P 500 could realistically fall to around 525 before the market bottoms. If you are buying solely because the market is "cheap" or "near a bottom", keep in mind the 525 figure is based on actual historical valuations. We are not forecasting 525 on the S&P 500. We are just trying to understand how low valuations may get before investors feel compelled to step in and buy. To reach "worst-case bear market bottom valuations" the S&P 500 would need to fall 32% from Tuesday’s close. If you lose 32%, you will need to make 47% just to be back to break even. For example, if you hold between 768 and 525 on the S&P 500, you will lose 31.6%. A 31.6% loss on $100,000 would leave you with $68,400. If you gain 47% on $68,400, you would earn $32,148. $68,400 + $32,148 = $100,548 (back to break even).
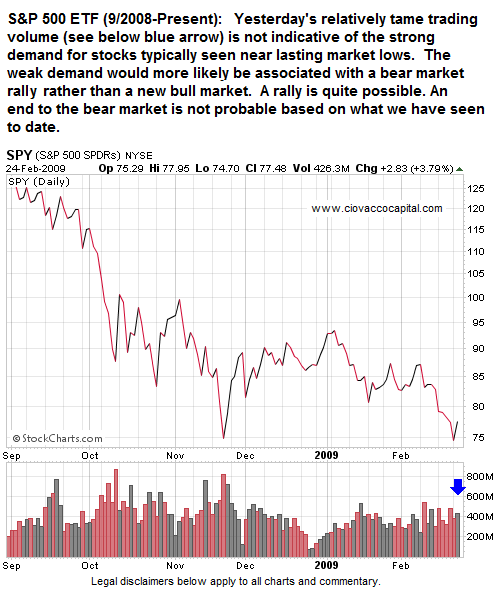
- Range Traders: Range traders are just that "traders". They are not long-term investors. They try to profit from buying at the low end of a trading range and selling at the top of the range. Stocks are at the low end of a trading range that began in October 2008. Range traders may have no intention of holding for the long-term, which means their buying pressure will be converted to selling pressure in the future. Yesterday’s volume looks like bargain hunting and range traders stepping in – it does not look like the beginning of a new bull market. Could stocks rally from here? Yes. Could yesterday have been the end of the bear market? Not likely, but if we see observable evidence to signal a significant change in trend, then we will consider putting more capital at risk. We need to see more. We need to remain patient for now. If you waited for clear signs of a trend change after the 2000-2003 bear market, you would have invested more aggressively (and with more confidence between May 1, 2003 and May 14, 2003). The S&P 500 still increased roughly 69% from the May 14th closing price to the bull market high in 2007 - a great return with a good risk/reward profile (much better than today's risk/reward profile). Since we sold early and protected our principal, we have the luxury of being patient. Even if you did not sell early, we remain in a bear market and protecting principal is still very important as illustrated by the 32% loss / 47% gain example above.
The charts below put some context around yesterday's moves in both stocks and gold. How a long-term investor and a trader interpret yesterday's moves may be quite different. For investors, gold still looks attractive and stocks remain unattractive.

Volume can help us better understand investor's
demand for or confidence in stocks. When investors are
confident, stock market gains occur on strong volume.

If you scroll down to the section 2008 - Monday's
Gains - The Bad News: Weak Volume in the October
13, 2008 article
Bear Markets Tend To Retest Lows, you can see volume
on SPY (S&P 500 ETF) at 2000-2002 bear market lows.
Compare the chart of SPY (2000-2002) to the chart of
SPY above focusing on trading volume.

Strong volume could still come, but it did not
occur yesterday in a manner that is similar to lasting
market turns. In the up/down volume figures above (see
red box), we would like to see something in the 90%
/ 10% range rather than the 79% / 20% that we saw yesterday.
Detailed research conducted by Lowery’s Reports over
the last 76 years of market history supports the 90%
/ 10% comment above. At a bear market bottom, we need
to see powerful demand for stocks.
Gold Had A Bad Day: One day does not make a trend. Tuesday's pullback does nothing to damage the uptrend off the October 2008 low. Volume on GLD and GDX are somewhat high which is a little bit of a concern, but it is not surprising to see a sharp retracement after a good run. Investors should manage gold as we would any other investment, which includes monitoring gains and losses and protecting capital when needed.

AIG Back To Uncle Sam’s Well – From Reuters:
NEW YORK - American International Group, rescued twice last year by the U.S. government, is asking for more aid and bracing for a fourth-quarter loss of roughly $60 billion, a source familiar with the matter said. It would be the biggest loss in a quarter in corporate history.
FDIC Sees More Trouble Ahead: Monday’s Wall Street Journal reported FDIC officials are "pushing Congress to raise the amount of money the agency can borrow from Treasury to $100 billion, more than triple its current limit". If the FDIC thought we were on the cusp of an economic and housing turn, they would not be lobbying so hard for new funds. The FDIC knows banks have much more pain in their future.
Housing Prices and Banks Will Continue To Be Under Pressure: Stock futures are higher in Monday’s premarket on more government bailout news – once again related to Citigroup. This bailout, as with many before it, does not directly address the fundamental problem with housing – too much inventory. As we have mentioned on numerous occasions, no government bailout or mortgage program can alter the natural laws of supply and demand. Using the pace of sales in December 2008, it would take 12.9 months to sell all the new homes currently in inventory. We need to get down to five or six months of inventory before we can expect to see prices stabilize. A glut of supply means home prices will remain under pressure. Falling home prices means more problems for banks. Mark Zandi, chief economist at Moody’s Economy.com, estimates that even with the new Obama foreclosure reduction plan, the United States will see 3.1 million foreclosures in 2009. We had a record 2.7 million in 2008. Home prices will continue to be a problem. Foreclosures will continue to be a problem. Banks will continue to be a problem. Despite this weeks’s hope of another lifeline for comatose Citigroup, the fundamental problems with our economy remain.
Citigroup – Third Bailout A Charm? The Wall Street Journal reported on Sunday night the U.S. government is in talks with Citigroup to "substantially" expand its ownership of the poorly managed bank. The new deal could result in taxpayers owning up to 40% of Citigroup. With new government bailouts coming at dizzying rates, it is easy to lose track of how much the Feds have already committed to Citigroup. To refresh your memory:
- October 2008: The Treasury Department
gave $25 billion to Citigroup
- November 2008: $20 billion more was given
to Citigroup
- November 2008: The government agreed to protect Citigroup from losses on $301 billion in assets.
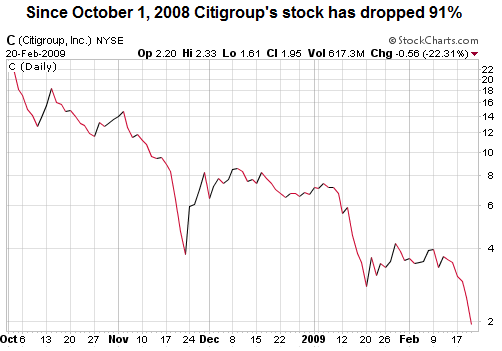
The sum of the government’s backing of Citigroup to date comes to roughly $346 billion. Has it worked? Below is a chart of Citigroup stock since October 1, 2008. The market has not been impressed.

More details on nationalization can be found in this Bloomberg article, Obama Bank Nationalization Is Focus of Speculation
Chris Ciovacco
Ciovacco Capital Management

Chris Ciovacco is the Chief Investment Officer for Ciovacco Capital Management, LLC. More on the web at www.ciovaccocapital.com
Subscribe to our FREE monthly E-zine and keep up with the latest Trends and Inflation information. And receive a Free copy of "15 Ways to Beat 95% of Investors".


Comment Policy: Your words are your own, so be nice and helpful if you can. Please, only use your real name and limit the amount of links submitted in your comment.