Back in March '03 when my ROC stock market predictor turned bullish it was difficult to get anyone to listen, everyone was extremely bearish. By 2006 surveys said 80% of market participants were bullish.
At that time I asked, Is it time to become bearish?
At that time, oil began it's meteoric rise in prices.
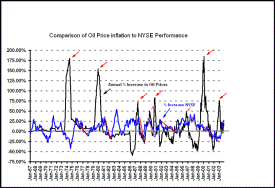
I first wrote this article to explain an apparent correlation in the rise in oil prices and the fall in stock prices.
The way the theory goes is that a sharp increase in oil prices on the magnitude of 50% to 100% annual increase has historically resulted in a sharp decline in the stock market price.
Logically speaking there is some good reasons why this might be the case.
1) A spike in Oil prices introduces uncertainty into the market.
2) Higher Oil prices increases transportation, heating and production costs.
Given both of these factors it is quite logical that increased oil costs could result in a decline in the stock market. So I have prepared a chart comparing the annual percent increase in Oil prices with the annual percent increase in the NYSE.
Recently the Oil price peak in February of 2000 was accompanied by the most recent stock decline.
Note that each "Red Arrow" points to a peak in the oil price above 50% and each was followed by a decline in the NYSE rate of return. Each "Red Line" indicates the decline in the NYSE. Remember that the NYSE Chart is not the price but the percent increase, so a 0% increase would indicate a flat stock market.
There are also two "Pink Arrows" that are peaks that are very near 50% and the peak in October of 1989 was accompanied by a simultaneous market decline while the peak in October of 1996 was also followed by a steep decline 17 months later. So it appears that the two "Pink Arrow" peaks are less reliable timing indicators than those that are higher peaks but still appear to have some validity.
Statistically, we can see from the table below that the delay after an oil peak was any where from two months to 17 months with the average delay being around 12 months.
| Delay between Oil Spike and NYSE decline | ||
| Oil Peak | NASD Peak | Months Delay |
| Jul-74 | Sep-75 | 14 |
| Dec-79 | Mar-81 | 15 |
| Jul-87 | Sep-87 | 2 |
| Oct-90 | Oct-91 | 12 |
| Oct-96 | Mar-98 | 17 |
| Feb-00 | Sep-00 | 7 |
| Ave. # Months | ~12 | |
So what does that mean for today?
With Oil reaching new highs every day caution is advised for the stock market.
For more information See our chart with Current Inflation adjusted Oil Prices.


Comment Policy: Your words are your own, so be nice and helpful if you can. Please, only use your real name and limit the amount of links submitted in your comment.